Annotate metabolites according to MS1 database using metID package
Xiaotao Shen PhD (https://www.shenxt.info/)
Si Wu PhD
School of Medicine, Stanford UniversityCreated on 2020-03-28 and updated on 2021-07-03
Source:vignettes/metabolite_annotation_using_MS1.Rmd
metabolite_annotation_using_MS1.RmdMS1 data preparation
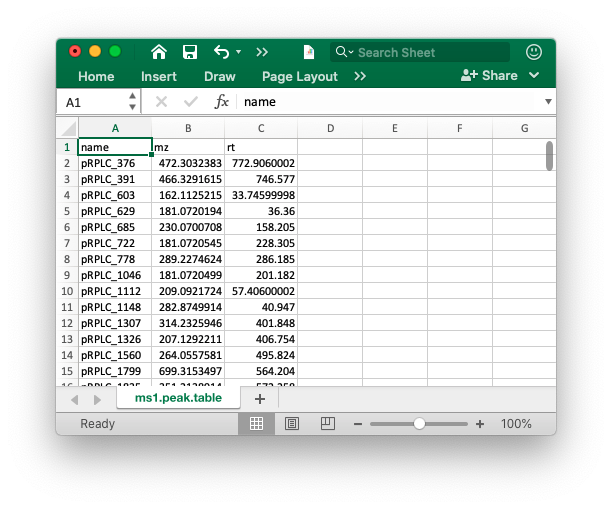
The peak table must contain “name” (peak name), “mz” (mass to charge ratio) and “rt” (retention time, unit is second). It can be from any data processing software (XCMS, MS-DIAL and so on).
Database
The database must be generated using constructDatabase() function. You can also use the public databases we provoded here.
Data organization
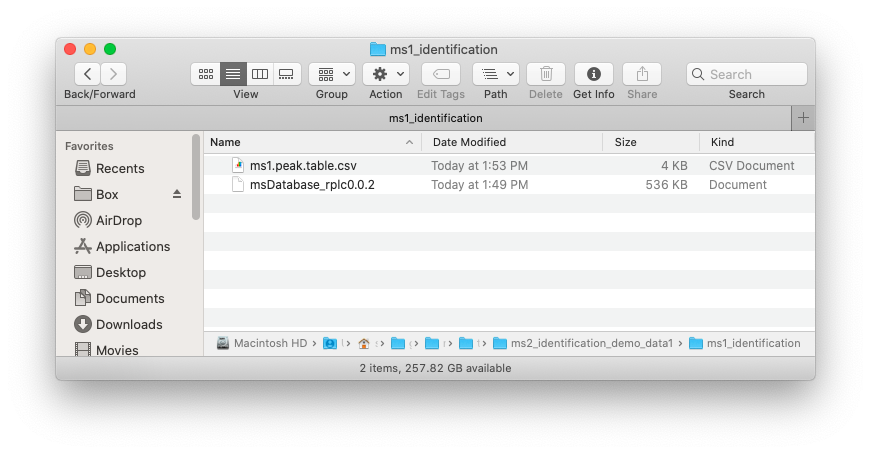
Place the MS1 peak table and databases which you want to use in one folder like below figure shows:
Run identify_metabolites() function
We use the demo data in metID package to show how to use metID to identify metabolites without MS2 spectra.
Load demo data
First we load the MS1 peak and database from metID package and then put them in a example folder.
##create a folder named as example
path <- file.path(".", "example")
dir.create(path = path, showWarnings = FALSE)

##get MS1 peak table from metID
ms1_peak <- system.file("ms1_peak", package = "metID")
file.copy(from = file.path(ms1_peak, "ms1.peak.table.csv"),
          to = path, overwrite = TRUE, recursive = TRUE)
#> [1] TRUE

##get database from metID
database <- system.file("ms2_database", package = "metID")

file.copy(from = file.path(database, "msDatabase_rplc0.0.2"),
          to = path, overwrite = TRUE, recursive = TRUE)
#> [1] TRUE
Now in your ./example, there are two files, namely ms1.peak.table.csv and msDatabase_rplc_0.0.2, respectively.
Only use m/z for metabolite identification
First, we only use m/z for metabolite identification.
annotate_result1 <-
  identify_metabolites(ms1.data = "ms1.peak.table.csv",
                       ms1.match.ppm = 15,
                       rt.match.tol = 1000000,
                       polarity = "positive",
                       column = "rp",
                       path = path,
                       candidate.num = 3,
                       database = "msDatabase_rplc0.0.2",
                       threads = 5)
#> You don't provide MS2 data, so only use mz and/or RT for matching.
#> You set rt.match.tol > 10,000, so RT will not be used for matching.
#>
  |
  |                                                                      |   0%
  |
  |==============                                                        |  20%
  |
  |============================                                          |  40%
  |
  |==========================================                            |  60%
  |
  |========================================================              |  80%
  |
  |======================================================================| 100%
#>
#> All done.
Note: because here we only want to use m/z for metabolite identification, so please set
rt.match.tol(second) > 10,000, for example ‘1000000’ here, so the RT will not be used for filtering.
Other parameters:
ms1.data: The ms1 peak table name.ms1.match.ppm: MS1 match tolerance (ppm).polarity: positive or negative.column: hilic or rp.path: Where are your data placaed?candidate.num: The candidate number for each peak.database: The database name or database.threads: How many threads you want to use.
The return result annotate_result1 is a metIdentifyClass object, you can directory get the brief information by print it in console:
annotate_result1
#> --------------metID version-----------
#> 0.4.1
#> -----------Identifications------------
#> (Use get_identification_table() to get identification table)
#> There are 100 peaks
#> 0 peaks have MS2 spectra
#> There are 98 metabolites are identified
#> There are 55 peaks with identification
#> -----------Parameters------------
#> (Use get_parameters() to get all the parameters of this processing)
#> Polarity: positive
#> Collision energy: all
#> database: msDatabase_rplc0.0.2
#> Total score cutoff: 0.5
#> Column: rp
#> Adduct table:
#> (M+H)+;(M+H-H2O)+;(M+H-2H2O)+;(M+NH4)+;(M+Na)+;(M-H+2Na)+;(M-2H+3Na)+;(M+K)+;(M-H+2K)+;(M-2H+3K)+;(M+CH3CN+H)+;(M+CH3CN+Na)+;(2M+H)+;(2M+NH4)+;(2M+Na)+;(2M+K)+;(M+HCOO+2H)+
Note:
now we can also provide “databaseClass” object for “database” argument. For example: we load the database first.
msDatabase_rplc0.0.2
#> -----------Base information------------
#> Version: 0.0.2
#> Source: MS
#> Link: http://snyderlab.stanford.edu/
#> Creater: Xiaotao Shen ( shenxt1990@163.com )
#> With RT information
#> -----------Spectral information------------
#> There are 14 items of metabolites in database:
#> Lab.ID; Compound.name; mz; RT; CAS.ID; HMDB.ID; KEGG.ID; Formula; mz.pos; mz.neg; Submitter; Family; Sub.pathway; Note
#> There are 833 metabolites in total
#> There are 356 metabolites in positive mode with MS2 spectra.
#> There are 534 metabolites in negative mode with MS2 spectra.
#> Collision energy in positive mode (number:):
#> Total number: 2
#> NCE25; NCE50
#> Collision energy in negative mode:
#> Total number: 2
#> NCE25; NCE50
Then we can directory provide this database to
identify_metabolites():
annotate_result2 <-
  identify_metabolites(ms1.data = "ms1.peak.table.csv",
                       ms1.match.ppm = 15,
                       rt.match.tol = 1000000,
                       polarity = "positive",
                       column = "rp",
                       path = path,
                       candidate.num = 3,
                       database = msDatabase_rplc0.0.2,
                       threads = 5)
#> You don't provide MS2 data, so only use mz and/or RT for matching.
#> You set rt.match.tol > 10,000, so RT will not be used for matching.
#>
  |
  |                                                                      |   0%
  |
  |==============                                                        |  20%
  |
  |============================                                          |  40%
  |
  |==========================================                            |  60%
  |
  |========================================================              |  80%
  |
  |======================================================================| 100%
#>
#> All done.
But what should be noticed is that it have different name for database in the final result:
annotate_result1@database
#> [1] "msDatabase_rplc0.0.2"
annotate_result2@database
#> [1] "MS_0.0.2"
It is because that if you give the
databaseClass, soidentify_metabolitescan know the name of database, if just use thesourceandversionas the name for database.
paste(msDatabase_rplc0.0.2@database.info$Source,
      msDatabase_rplc0.0.2@database.info$Version,
      sep = "_")
#> [1] "MS_0.0.2"
Only use m/z and RT for metabolite identification
Here we set RT tolerance (rt.match.tol) as 30 s.
annotate_result2 <-
  identify_metabolites(ms1.data = "ms1.peak.table.csv",
                       ms1.match.ppm = 15,
                       rt.match.tol = 30,
                       polarity = "positive",
                       column = "rp",
                       path = path,
                       candidate.num = 3,
                       database = "msDatabase_rplc0.0.2",
                       threads = 5)
#> You don't provide MS2 data, so only use mz and/or RT for matching.
#> You set rt.match.tol < 10,000, so if the metabolites have RT,  RTs will be used for matching
#>
  |
  |                                                                      |   0%
  |
  |==============                                                        |  20%
  |
  |============================                                          |  40%
  |
  |==========================================                            |  60%
  |
  |========================================================              |  80%
  |
  |======================================================================| 100%
#>
#> All done.
Get detailed annotation information
After get the annotation_result, we can get the detailed information from it.
Get the processing parameters
We can use get_parameters() function to get the detailed parameters. This is very useful for reproductive analysis for data analysis.
metID::get_parameters(annotate_result1)
#> `get_parameters()` is deprecated, use `get_parameters_metID()`.
#> # A tibble: 17 x 3
#>    Parameter          Meaning                                   Value
#>    <chr>              <chr>                                     <chr>
#>  1 ms1.ms2.match.mz.… MS1 features & MS spectra matching mz to… 25
#>  2 ms1.ms2.match.rt.… MS1 features & MS spectra matching RT to… 10
#>  3 ms1.match.ppm      MS1 match tolerance (ppm)                 15
#>  4 ms2.match.ppm      MS2 fragment match tolerance (ppm)        30
#>  5 ms2.match.tol      MS2 match tolerance                       0.5
#>  6 rt.match.tol       RT match tolerance (s)                    1e+06
#>  7 polarity           Polarity                                  positive
#>  8 ce                 Collision energy                          all
#>  9 column             Column                                    rp
#> 10 ms1.match.weight   MS1 match weight                          0.25
#> 11 rt.match.weight    RT match weight                           0.25
#> 12 ms2.match.weight   MS2 match weight                          0.5
#> 13 path               Work directory                            ./example
#> 14 total.score.tol    Total score tolerance                     0.5
#> 15 candidate.num      Candidate number                          3
#> 16 database           MS2 database                              msDatabase_rplc…
#> 17 threads            Thread number                             1
metID::get_parameters(annotate_result2)
#> `get_parameters()` is deprecated, use `get_parameters_metID()`.
#> # A tibble: 17 x 3
#>    Parameter          Meaning                                   Value
#>    <chr>              <chr>                                     <chr>
#>  1 ms1.ms2.match.mz.… MS1 features & MS spectra matching mz to… 25
#>  2 ms1.ms2.match.rt.… MS1 features & MS spectra matching RT to… 10
#>  3 ms1.match.ppm      MS1 match tolerance (ppm)                 15
#>  4 ms2.match.ppm      MS2 fragment match tolerance (ppm)        30
#>  5 ms2.match.tol      MS2 match tolerance                       0.5
#>  6 rt.match.tol       RT match tolerance (s)                    30
#>  7 polarity           Polarity                                  positive
#>  8 ce                 Collision energy                          all
#>  9 column             Column                                    rp
#> 10 ms1.match.weight   MS1 match weight                          0.25
#> 11 rt.match.weight    RT match weight                           0.25
#> 12 ms2.match.weight   MS2 match weight                          0.5
#> 13 path               Work directory                            ./example
#> 14 total.score.tol    Total score tolerance                     0.5
#> 15 candidate.num      Candidate number                          3
#> 16 database           MS2 database                              msDatabase_rplc…
#> 17 threads            Thread number                             1
Check what peaks with annotations
Use which_has_identification() function to get what peaks have annotions.
which_has_identification(annotate_result1) %>%
  head()
#>   MS1.peak.name MS2.spectra.name
#> 1     pRPLC_376               NA
#> 2     pRPLC_391               NA
#> 3     pRPLC_603               NA
#> 4     pRPLC_629               NA
#> 5     pRPLC_685               NA
#> 6     pRPLC_722               NA
Because there are no ms2 data, so the peaks have no MS2 spectra.
Get the identification table
We can use get_identification_table() to get the identification table.
table1 <-
  get_identification_table(annotate_result1,
                           candidate.num = 3,
                           type = "old")
#> The object is identified without MS2 spectra.
table1
#> # A tibble: 100 x 5
#>    name        mz    rt Candidate.number Identification
#>    <chr>    <dbl> <dbl>            <dbl> <chr>
#>  1 pRPLC_3…  472. 773.                 3 Compound.name:Chenodeoxycholic acid gl…
#>  2 pRPLC_3…  466. 747.                 1 Compound.name:C18:0 AC (Stearoylcarnit…
#>  3 pRPLC_6…  162.  33.7                2 Compound.name:L(-)-Carnitine;CAS.ID:NA…
#>  4 pRPLC_6…  181.  36.4                3 Compound.name:THEOBROMINE;CAS.ID:NA;HM…
#>  5 pRPLC_6…  230. 158.                 3 Compound.name:Pyridoxic acid;CAS.ID:82…
#>  6 pRPLC_7…  181. 228.                 3 Compound.name:THEOBROMINE;CAS.ID:NA;HM…
#>  7 pRPLC_7…  289. 286.                 0 <NA>
#>  8 pRPLC_1…  181. 201.                 3 Compound.name:THEOBROMINE;CAS.ID:NA;HM…
#>  9 pRPLC_1…  209.  57.4                3 Compound.name:5-HYDROXYINDOLEACETATE;C…
#> 10 pRPLC_1…  283.  40.9                0 <NA>
#> # … with 90 more rows
The type is set as old. It means the identifications for each peak is shown as one character and seperated by {}. And the order is sorted by Total score.
You can also set type as new to get another style.
table2 <-
  get_identification_table(annotate_result1, candidate.num = 3,
                           type = "new")
#> The object is identified without MS2 spectra.
table2
#> # A tibble: 169 x 19
#>    name      mz    rt MS2.spectra.name Candidate.number Compound.name     CAS.ID
#>    <chr>  <dbl> <dbl> <lgl>            <lgl>            <chr>             <chr>
#>  1 pRPLC…  472. 773.  NA               NA               Chenodeoxycholic… 640-7…
#>  2 pRPLC…   NA   NA   NA               NA               CHOLATE           <NA>
#>  3 pRPLC…   NA   NA   NA               NA               Cholic Acid       <NA>
#>  4 pRPLC…  466. 747.  NA               NA               C18:0 AC (Stearo… 1976-…
#>  5 pRPLC…  162.  33.7 NA               NA               L(-)-Carnitine    <NA>
#>  6 pRPLC…   NA   NA   NA               NA               L-Carnitine       541-1…
#>  7 pRPLC…  181.  36.4 NA               NA               THEOBROMINE       <NA>
#>  8 pRPLC…   NA   NA   NA               NA               5-Acetylamino-6-… <NA>
#>  9 pRPLC…   NA   NA   NA               NA               Theophylline      <NA>
#> 10 pRPLC…  230. 158.  NA               NA               Pyridoxic acid    82-82…
#> # … with 159 more rows, and 12 more variables: HMDB.ID <chr>, KEGG.ID <chr>,
#> #   Lab.ID <chr>, Adduct <chr>, mz.error <dbl>, mz.match.score <dbl>,
#> #   RT.error <dbl>, RT.match.score <dbl>, CE <chr>, SS <dbl>,
#> #   Total.score <dbl>, Database <chr>
If you only want to keep one cancidate for each peak. Please set candiate.num as 1.
table2 <-
  get_identification_table(annotate_result1, candidate.num = 2,
                           type = "new")
#> The object is identified without MS2 spectra.
table2
#> # A tibble: 141 x 19
#>    name      mz    rt MS2.spectra.name Candidate.number Compound.name     CAS.ID
#>    <chr>  <dbl> <dbl> <lgl>            <lgl>            <chr>             <chr>
#>  1 pRPLC…  472. 773.  NA               NA               Chenodeoxycholic… 640-7…
#>  2 pRPLC…   NA   NA   NA               NA               CHOLATE           <NA>
#>  3 pRPLC…  466. 747.  NA               NA               C18:0 AC (Stearo… 1976-…
#>  4 pRPLC…  162.  33.7 NA               NA               L(-)-Carnitine    <NA>
#>  5 pRPLC…   NA   NA   NA               NA               L-Carnitine       541-1…
#>  6 pRPLC…  181.  36.4 NA               NA               THEOBROMINE       <NA>
#>  7 pRPLC…   NA   NA   NA               NA               5-Acetylamino-6-… <NA>
#>  8 pRPLC…  230. 158.  NA               NA               Pyridoxic acid    82-82…
#>  9 pRPLC…   NA   NA   NA               NA               Pyridoxic acid    82-82…
#> 10 pRPLC…  181. 228.  NA               NA               THEOBROMINE       <NA>
#> # … with 131 more rows, and 12 more variables: HMDB.ID <chr>, KEGG.ID <chr>,
#> #   Lab.ID <chr>, Adduct <chr>, mz.error <dbl>, mz.match.score <dbl>,
#> #   RT.error <dbl>, RT.match.score <dbl>, CE <chr>, SS <dbl>,
#> #   Total.score <dbl>, Database <chr>
Get the identification information for single peak
We can use get_iden_info() function to get the detailed information for a sinlge peak. Because it gets the information from the database, so this function need provide the database.
First, we need to know what peaks have annotations.
which_has_identification(annotate_result1) %>%
  head()
#>   MS1.peak.name MS2.spectra.name
#> 1     pRPLC_376               NA
#> 2     pRPLC_391               NA
#> 3     pRPLC_603               NA
#> 4     pRPLC_629               NA
#> 5     pRPLC_685               NA
#> 6     pRPLC_722               NA
Then we can get the annotation for peak pRPLC_376 use get_iden_info() function.
load(file.path(path, "msDatabase_rplc0.0.2"))
get_iden_info(object = annotate_result1,
              which.peak = "pRPLC_376",
              database = msDatabase_rplc0.0.2)
#> # A tibble: 3 x 22
#>   Compound.name        CAS.ID  HMDB.ID  KEGG.ID Lab.ID Adduct  mz.error RT.error
#>   <chr>                <chr>   <chr>    <chr>   <chr>  <chr>      <dbl> <lgl>
#> 1 Chenodeoxycholic ac… 640-79… HMDB006… C05466  RPLC_… (M+Na)+    0.240 NA
#> 2 CHOLATE              <NA>    <NA>     <NA>    RPLC_… (M+CH3…    0.300 NA
#> 3 Cholic Acid          <NA>    HMDB000… <NA>    RPLC_… (M+CH3…    0.452 NA
#> # … with 14 more variables: mz.match.score <dbl>, RT.match.score <lgl>,
#> #   Total.score <dbl>, CE <lgl>, SS <dbl>, mz <chr>, RT <dbl>, Formula <chr>,
#> #   mz.pos <dbl>, mz.neg <dbl>, Submitter <chr>, Family <chr>,
#> #   Sub.pathway <chr>, Note <chr>
We can get the detailed information for metabolites in database.
Filter identifications
After we get the annotation result use identify_metabolites() function. We can also use filter_identification() function to filter annotations based on m/z, rt and MS2 match tolerance.
annotate_result2_2 <-
  filter_identification(object = annotate_result2,
                        rt.match.tol = 5)
annotate_result2_2
#> --------------metID version-----------
#> 0.9.0
#> -----------Identifications------------
#> (Use get_identification_table() to get identification table)
#> There are 100 peaks
#> 0 peaks have MS2 spectra
#> There are 9 metabolites are identified
#> There are 6 peaks with identification
#> -----------Parameters------------
#> (Use get_parameters() to get all the parameters of this processing)
#> Polarity: positive
#> Collision energy: all
#> database: msDatabase_rplc0.0.2
#> Total score cutoff: 0.5
#> Column: rp
#> Adduct table:
#> (M+H)+;(M+H-H2O)+;(M+H-2H2O)+;(M+NH4)+;(M+Na)+;(M-H+2Na)+;(M-2H+3Na)+;(M+K)+;(M-H+2K)+;(M-2H+3K)+;(M+CH3CN+H)+;(M+CH3CN+Na)+;(2M+H)+;(2M+NH4)+;(2M+Na)+;(2M+K)+;(M+HCOO+2H)+
annotate_result2
#> --------------metID version-----------
#> 0.9.0
#> -----------Identifications------------
#> (Use get_identification_table() to get identification table)
#> There are 100 peaks
#> 0 peaks have MS2 spectra
#> There are 47 metabolites are identified
#> There are 24 peaks with identification
#> -----------Parameters------------
#> (Use get_parameters() to get all the parameters of this processing)
#> Polarity: positive
#> Collision energy: all
#> database: msDatabase_rplc0.0.2
#> Total score cutoff: 0.5
#> Column: rp
#> Adduct table:
#> (M+H)+;(M+H-H2O)+;(M+H-2H2O)+;(M+NH4)+;(M+Na)+;(M-H+2Na)+;(M-2H+3Na)+;(M+K)+;(M-H+2K)+;(M-2H+3K)+;(M+CH3CN+H)+;(M+CH3CN+Na)+;(2M+H)+;(2M+NH4)+;(2M+Na)+;(2M+K)+;(M+HCOO+2H)+