Identify peak tables with multiple databases
Xiaotao Shen PhD (https://www.shenxt.info/)
Si Wu PhD
School of Medicine, Stanford UniversityCreated on 2020-03-28 and updated on 2021-07-03
Source:vignettes/multiple_databases.Rmd
multiple_databases.RmdSome time we have multiple databases, so we can use identify_metabolite_all() functions to identify metabolites using multiple database.
MS1 data preparation
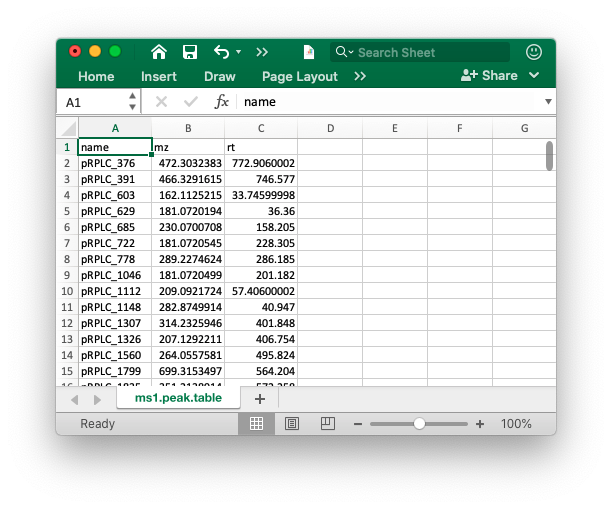
The peak table must contain “name” (peak name), “mz” (mass to charge ratio) and “rt” (retention time, unit is second). It can be from any data processing software (XCMS, MS-DIAL and so on).

MS2 data preparation
The raw MS2 data from DDA or DIA should be transfered to msp, mgf or mzXML format files using ProteoWizard software.
Database
The database must be generated using construct_database() function. Here we use the databases in metID packages.
msDatabase_rplc0.0.2: A in-house database, it contains m/z, RT and MS2 spectra information.orbitrapDatabase0.0.1: A public database fromMassBank. It contains m/z and MS2 spectra information.hmdbMS1Database0.0.1: A public database fromHMDB, only contains m/z information.
Data organization
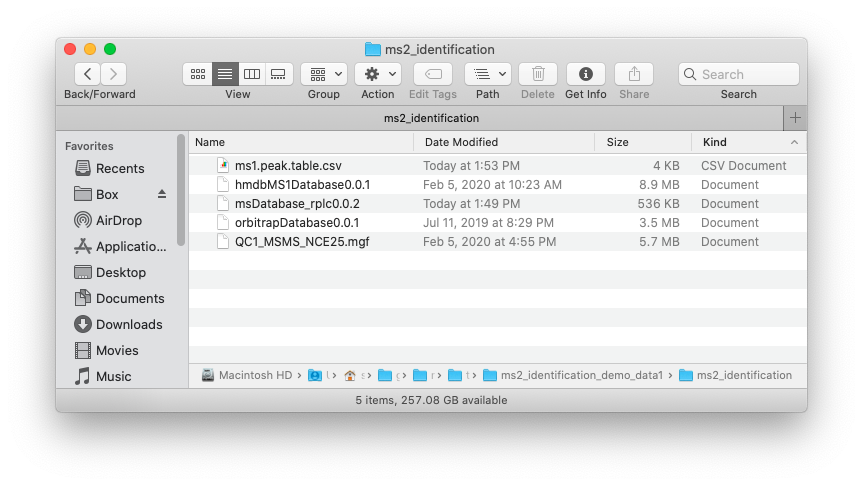
Place the MS1 peak table, MS2 data and databases which you want to use in one folder like below figure shows:

Run identify_metabolite_all() function
We use the demo data in metID package.
Load demo data
First we load the MS1 peak, MS2 data and databases from metID package and then put them in a example folder.
##creat a folder nameed as example
path <- file.path(".", "example")
dir.create(path = path, showWarnings = FALSE)

##get MS1 peak table from metID
ms1_peak <- system.file("ms1_peak", package = "metID")
file.copy(
  from = file.path(ms1_peak, "ms1.peak.table.csv"),
  to = path,
  overwrite = TRUE,
  recursive = TRUE
)
#> [1] TRUE

##get MS2 data from metID
ms2_data <- system.file("ms2_data", package = "metID")
file.copy(
  from = file.path(ms2_data, "QC1_MSMS_NCE25.mgf"),
  to = path,
  overwrite = TRUE,
  recursive = TRUE
)
#> [1] TRUE

##get databases from metID
database <- system.file("ms2_database", package = "metID")

file.copy(
  from = file.path(
    database,
    c(
      "msDatabase_rplc0.0.2",
      "orbitrapDatabase0.0.1",
      "hmdbMS1Database0.0.1"
    )
  ),
  to = path,
  overwrite = TRUE,
  recursive = TRUE
)
#> [1] TRUE TRUE TRUE
Now in your ./example, there are files files, namely ms1.peak.table.csv, QC1_MSMS_NCE25.mgf and three databases.
Set parameter list
We need to use identify_metabolites_params() functions to set parameter list for each database.
param1 <-
  identify_metabolites_params(
    ms1.match.ppm = 15,
    rt.match.tol = 15,
    polarity = "positive",
    ce = "all",
    column = "rp",
    total.score.tol = 0.5,
    candidate.num = 3,
    threads = 3,
    database = "msDatabase_rplc0.0.2"
  )

param2 <- identify_metabolites_params(
  ms1.match.ppm = 15,
  rt.match.tol = 15,
  polarity = "positive",
  ce = "all",
  column = "rp",
  total.score.tol = 0.5,
  candidate.num = 3,
  threads = 3,
  database = "orbitrapDatabase0.0.1"
)

param3 <- identify_metabolites_params(
  ms1.match.ppm = 15,
  rt.match.tol = 15,
  polarity = "positive",
  ce = "all",
  column = "rp",
  total.score.tol = 0.5,
  candidate.num = 3,
  threads = 3,
  database = "hmdbMS1Database0.0.1"
)
Note: You can set different parametes for each database.
Metabolite identification
All the parameters for three databases should be provided to parameter.list.
result <- identify_metabolite_all(
  ms1.data = "ms1.peak.table.csv",
  ms2.data = "QC1_MSMS_NCE25.mgf",
  parameter.list = c(param1, param2, param3),
  path = path
)
#> Use old data
#> -------------------------------
#> Database 1 : msDatabase_rplc0.0.2
#> -------------------------------
#> -------------------------------
#> Database 2 : orbitrapDatabase0.0.1
#> -------------------------------
#> -------------------------------
#> Database 3 : hmdbMS1Database0.0.1
#> -------------------------------
Note:
resultis a list, and each element is ametIdentifyClassobject. So you can use the functions formetIdentifylassobject to process it.
Integrate annotation results from different databases
After we get the annotation result list, we then can integrate the annotation results from different databases.
For msDatabase_rplc0.0.2, the annotaiton results are Level 1 according to MSI.
result[[1]]
#> --------------metID version-----------
#> 0.4.1
#> -----------Identifications------------
#> (Use get_identification_table() to get identification table)
#> There are 100 peaks
#> 23 peaks have MS2 spectra
#> There are 14 metabolites are identified
#> There are 10 peaks with identification
#> -----------Parameters------------
#> (Use get_parameters() to get all the parameters of this processing)
#> Polarity: positive
#> Collision energy: all
#> database: msDatabase_rplc0.0.2
#> Total score cutoff: 0.5
#> Column: rp
#> Adduct table:
#> (M+H)+;(M+H-H2O)+;(M+H-2H2O)+;(M+NH4)+;(M+Na)+;(M-H+2Na)+;(M-2H+3Na)+;(M+K)+;(M-H+2K)+;(M-2H+3K)+;(M+CH3CN+H)+;(M+CH3CN+Na)+;(2M+H)+;(2M+NH4)+;(2M+Na)+;(2M+K)+;(M+HCOO+2H)+
Then get the annotation table.
annotation_table1 <-
  get_identification_table(result[[1]], type = "new", candidate.num = 1)
annotation_table1 %>%
  head()
#> # A tibble: 6 x 17
#>   name     mz    rt Compound.name CAS.ID HMDB.ID KEGG.ID Lab.ID Adduct mz.error
#>   <chr> <dbl> <dbl> <chr>         <chr>  <chr>   <chr>   <chr>  <chr>     <dbl>
#> 1 pRPL…  472. 773.  <NA>          <NA>   <NA>    <NA>    <NA>   <NA>      NA
#> 2 pRPL…  466. 747.  <NA>          <NA>   <NA>    <NA>    <NA>   <NA>      NA
#> 3 pRPL…  162.  33.7 L-Carnitine   541-1… HMDB00… C00318  RPLC_… (M+H)+     1.67
#> 4 pRPL…  181.  36.4 <NA>          <NA>   <NA>    <NA>    <NA>   <NA>      NA
#> 5 pRPL…  230. 158.  <NA>          <NA>   <NA>    <NA>    <NA>   <NA>      NA
#> 6 pRPL…  181. 228.  <NA>          <NA>   <NA>    <NA>    <NA>   <NA>      NA
#> # … with 7 more variables: mz.match.score <dbl>, RT.error <dbl>,
#> #   RT.match.score <dbl>, CE <chr>, SS <dbl>, Total.score <dbl>, Database <chr>
For orbitrapDatabase0.0.1, the annotaiton results are Level 2 according to MSI.
result[[2]]
#> --------------metID version-----------
#> 0.4.1
#> -----------Identifications------------
#> (Use get_identification_table() to get identification table)
#> There are 100 peaks
#> 23 peaks have MS2 spectra
#> There are 9 metabolites are identified
#> There are 7 peaks with identification
#> -----------Parameters------------
#> (Use get_parameters() to get all the parameters of this processing)
#> Polarity: positive
#> Collision energy: all
#> database: orbitrapDatabase0.0.1
#> Total score cutoff: 0.5
#> Column: rp
#> Adduct table:
#> (M+H)+;(M+H-H2O)+;(M+H-2H2O)+;(M+NH4)+;(M+Na)+;(M-H+2Na)+;(M-2H+3Na)+;(M+K)+;(M-H+2K)+;(M-2H+3K)+;(M+CH3CN+H)+;(M+CH3CN+Na)+;(2M+H)+;(2M+NH4)+;(2M+Na)+;(2M+K)+;(M+HCOO+2H)+
Then get the annotation table.
annotation_table2 <-
  get_identification_table(result[[2]], type = "new", candidate.num = 1)
annotation_table2 %>%
  head()
#> # A tibble: 6 x 17
#>   name     mz    rt Compound.name CAS.ID HMDB.ID KEGG.ID Lab.ID Adduct mz.error
#>   <chr> <dbl> <dbl> <chr>         <chr>  <chr>   <chr>   <chr>  <chr>     <dbl>
#> 1 pRPL…  472. 773.  <NA>          <NA>   <NA>    <NA>    <NA>   <NA>         NA
#> 2 pRPL…  466. 747.  <NA>          <NA>   <NA>    <NA>    <NA>   <NA>         NA
#> 3 pRPL…  162.  33.7 <NA>          <NA>   <NA>    <NA>    <NA>   <NA>         NA
#> 4 pRPL…  181.  36.4 <NA>          <NA>   <NA>    <NA>    <NA>   <NA>         NA
#> 5 pRPL…  230. 158.  <NA>          <NA>   <NA>    <NA>    <NA>   <NA>         NA
#> 6 pRPL…  181. 228.  <NA>          <NA>   <NA>    <NA>    <NA>   <NA>         NA
#> # … with 7 more variables: mz.match.score <dbl>, RT.error <dbl>,
#> #   RT.match.score <dbl>, CE <chr>, SS <dbl>, Total.score <dbl>, Database <chr>
For hmdbMS1Database0.0.1, the annotaiton results are Level 3 according to MSI.
result[[3]]
#> --------------metID version-----------
#> 0.4.1
#> -----------Identifications------------
#> (Use get_identification_table() to get identification table)
#> There are 100 peaks
#> 0 peaks have MS2 spectra
#> There are 266 metabolites are identified
#> There are 97 peaks with identification
#> -----------Parameters------------
#> (Use get_parameters() to get all the parameters of this processing)
#> Polarity: positive
#> Collision energy: all
#> database: hmdbMS1Database0.0.1
#> Total score cutoff: 0.5
#> Column: rp
#> Adduct table:
#> (M+H)+;(M+H-H2O)+;(M+H-2H2O)+;(M+NH4)+;(M+Na)+;(M-H+2Na)+;(M-2H+3Na)+;(M+K)+;(M-H+2K)+;(M-2H+3K)+;(M+CH3CN+H)+;(M+CH3CN+Na)+;(2M+H)+;(2M+NH4)+;(2M+Na)+;(2M+K)+;(M+HCOO+2H)+
Then get the annotation table.
annotation_table3 <-
  get_identification_table(result[[3]], type = "new", candidate.num = 1)
#> The object is identified without MS2 spectra.
annotation_table3 %>%
  head()
#> # A tibble: 6 x 17
#>   name     mz    rt Compound.name CAS.ID HMDB.ID KEGG.ID Lab.ID Adduct mz.error
#>   <chr> <dbl> <dbl> <chr>         <chr>  <chr>   <chr>   <chr>  <chr>     <dbl>
#> 1 pRPL…  472. 773.  Allocholic a… 2464-… HMDB00… C17737  HMDB0… (M+CH…   0.288
#> 2 pRPL…  466. 747.  LysoPA(18:0e… <NA>   HMDB00… <NA>    HMDB0… (M+CH…   0.0315
#> 3 pRPL…  162.  33.7 N-(3-Methylb… 13434… HMDB00… <NA>    HMDB0… (M+HC…   0.0186
#> 4 pRPL…  181.  36.4 Paraxanthine  611-5… HMDB00… C13747  HMDB0… (M+H)+   0.0153
#> 5 pRPL…  230. 158.  1-(Methylsul… 13221… HMDB00… <NA>    HMDB0… (M+NH…   0.391
#> 6 pRPL…  181. 228.  Dihydropteri… <NA>   HMDB00… C05649  HMDB0… (M+HC…   0.0207
#> # … with 7 more variables: RT.error <dbl>, mz.match.score <dbl>,
#> #   RT.match.score <dbl>, Total.score <dbl>, CE <chr>, SS <dbl>, Database <chr>
Then we should combine them together:
annotation_table1 <-
  annotation_table1 %>%
  dplyr::filter(!is.na(Compound.name))

dim(annotation_table1)
#> [1] 10 17

annotation_table1 <-
  data.frame(annotation_table1,
             Level = 1,
             stringsAsFactors = FALSE)
annotation_table2 <-
  annotation_table2 %>%
  dplyr::filter(!is.na(Compound.name))

dim(annotation_table2)
#> [1]  7 17

annotation_table2 <-
  data.frame(annotation_table2,
             Level = 2,
             stringsAsFactors = FALSE)
annotation_table3 <-
  annotation_table3 %>%
  dplyr::filter(!is.na(Compound.name))

dim(annotation_table3)
#> [1] 97 17

annotation_table3 <-
  data.frame(annotation_table3,
             Level = 3,
             stringsAsFactors = FALSE)
If one peak have annotation from three different database, we only contains the annotations with higher confidence.
annotation_table2 <-
  annotation_table2 %>%
  dplyr::filter(!(name %in% annotation_table1$name))

annotation_table <-
  rbind(annotation_table1,
        annotation_table2)
annotation_table3 <-
  annotation_table3 %>%
  dplyr::filter(!(name %in% annotation_table$name))

annotation_table <-
  rbind(annotation_table,
        annotation_table3)
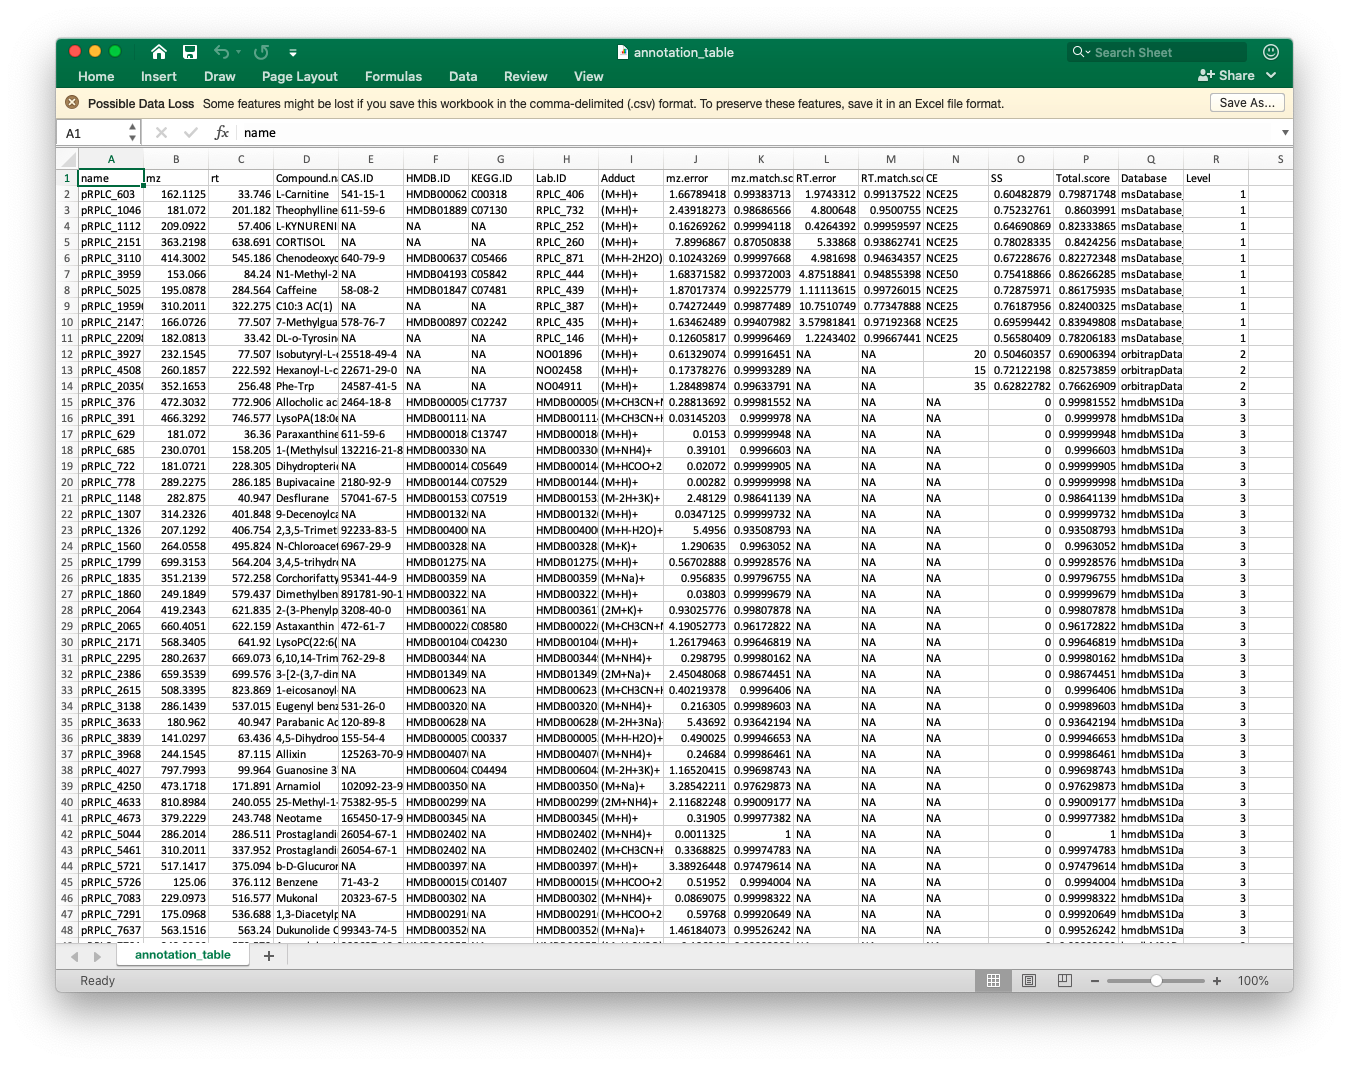
The annotation_table is the final annotation table.
Then we can output it as csv file.
readr::write_csv(annotation_table,
                 "annotation_table.csv")