Step 4: output and organize results
Xiaotao Shen PhD (https://www.shenxt.info/)
Chuchu wang PhD
School of Medicine, Stanford UniversityCreated on 2021-02-09 and updated on 2021-03-03
Source:vignettes/output_result.Rmd
output_result.RmdThen we need to output and organize some results. If you have not finished the previous step, please click here:
Step 3: get absolute quantification data.
Organize results
Here we first organize the plots of lipids to different groups according to lipid class.
Positive mode
match_item_pos =
list(
"Cer" = "d18:1 (d7)-15:0 Cer",
"ChE" = c("18:1(d7) Chol Ester", "Cholesterol (d7)"),
"Chol" = "Cholesterol (d7)",
"DG" = "15:0-18:1(d7) DAG",
"LPC" = "18:1(d7) Lyso PC",
"LPE" = "18:1(d7) Lyso PE",
"MG" = "18:1 (d7) MG",
"PA" = "15:0-18:1(d7) PA (Na Salt)",
"PC" = "15:0-18:1(d7) PC",
"PE" = "15:0-18:1(d7) PE",
"PG" = "15:0-18:1(d7) PG (Na Salt)",
"PI" = "15:0-18:1(d7) PI (NH4 Salt)",
"PPE" = "C18(Plasm)-18:1(d9) PE",
"PS" = "15:0-18:1(d7) PS (Na Salt)",
"SM" = "d18:1-18:1(d9) SM",
"TG" = "15:0-18:1(d7)-15:0 TAG"
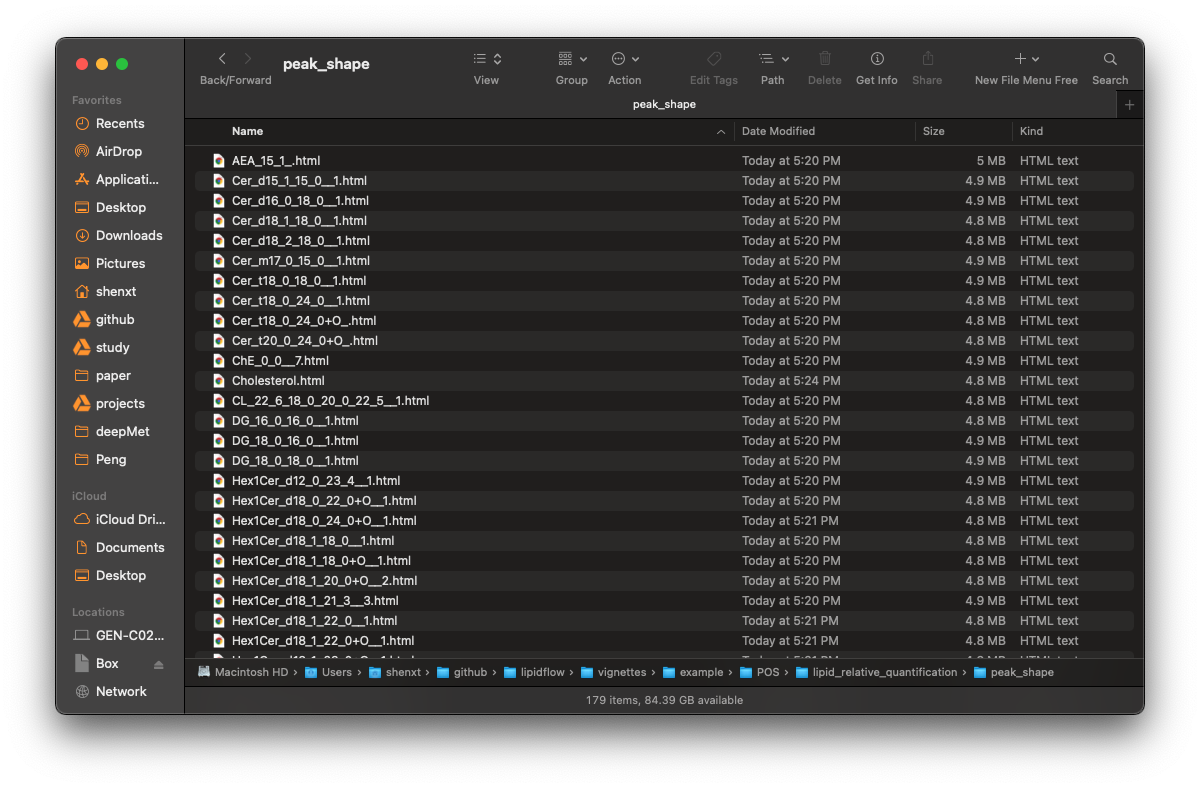
)We want to organize the peak shape of lipids in example/POS/lipid_relative_quantification/peak_shape to different folders according to lipid class.
Before organization
absolute_table <-
  readxl::read_xlsx("example/Result/lipid_data_um.xlsx")

reorganize_peak_plot(
  path = "example/POS/lipid_relative_quantification/",
  plot_dir = "peak_shape",
  absolute_table = absolute_table,
  match_item = match_item_pos
)
#> 1  2  3  4  5  6  7  8  9  10  11  12  13  14  15  16
After the organization, the folder is like this, all the lipids are placed into different folders according to their class.

After organization
Negative mode
Negative mode is same with positive mode:
match_item_neg =
  list(
    "Cer" = "d18:1 (d7)-15:0 Cer",
    "Chol" = "Cholesterol (d7)",
    "ChE" = c("18:1(d7) Chol Ester", "Cholesterol (d7)"),
    "LPC" = "18:1(d7) Lyso PC",
    "LPE" = "18:1(d7) Lyso PE",
    "PC" = "15:0-18:1(d7) PC",
    "PE" = "15:0-18:1(d7) PE",
    "PG" = "15:0-18:1(d7) PG (Na Salt)",
    "PI" = "15:0-18:1(d7) PI (NH4 Salt)",
    "PPE" = "C18(Plasm)-18:1(d9) PE",
    "PS" = "15:0-18:1(d7) PS (Na Salt)",
    "SM" = "d18:1-18:1(d9) SM"
  )
reorganize_peak_plot(
  path = "example/NEG/lipid_relative_quantification/",
  plot_dir = "peak_shape",
  absolute_table = absolute_table,
  match_item = match_item_neg
)
#> 1  2  3  4  5  6  7  8  9  10  11  12
Output some results
output_result(path = "example",
              match_item_pos = match_item_pos,
              match_item_neg = match_item_neg)
#> Positive mode...
#> Cer
#> ChE
#> Chol
#> DG
#> LPC
#> LPE  MG
#> PA  PC
#> PE
#> PG  PI
#> PPE
#> PS
#> SM
#> TG
#>
#> Negative mode...
#> Cer  Chol  ChE  LPC  LPE
#> PC
#> PE
#> PG
#> PI
#> PPE  PS
#> SM
#> 1
#> 2
#> 3
#> 4
#> 5
#> 6
#> 7
#> 8
#> 9
#> 10
#> 11
#> 12
#> 13
#> 14
#> 15
#>
#> Done.
The final results
Finally, all the results are in example/Result.
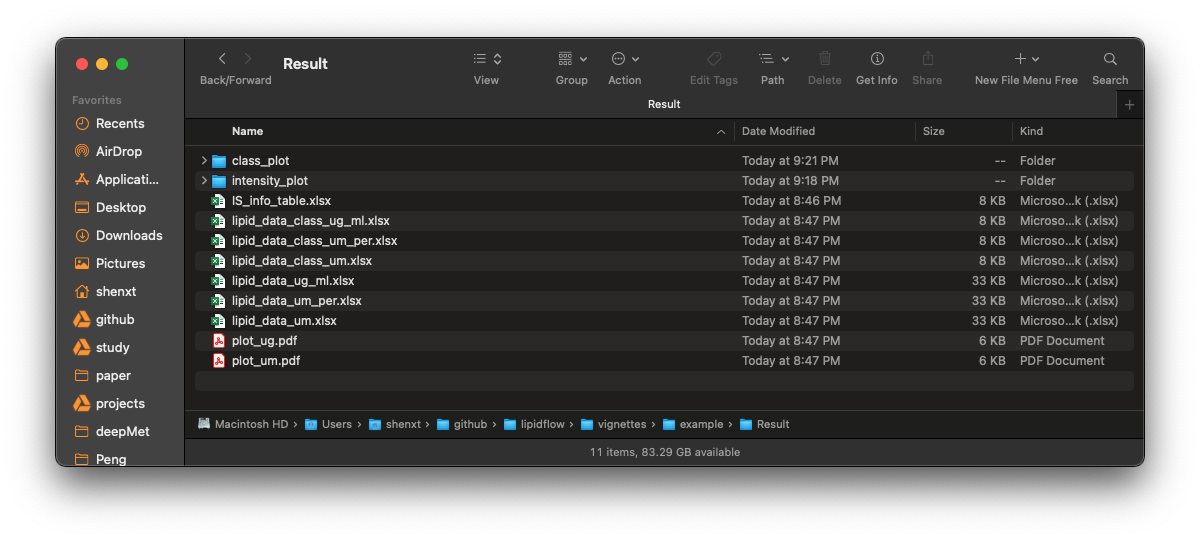
Final results
1. IS_info_table.xlsx
This table is the information of internal standards in positive and negative mode, respectively.

2. lipid_data_class_ug_ml.xlsx
This table is the absolute quantification table for each sample in lipid class level (ug/ml).

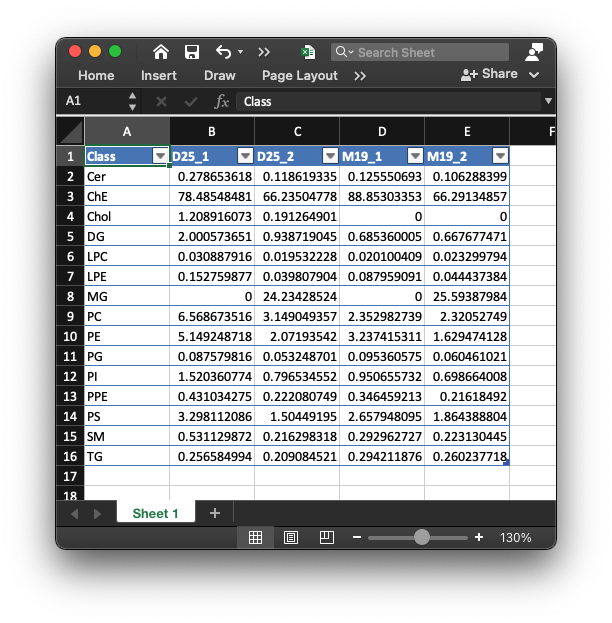
3. lipid_data_class_um_per.xlsx
This table is the absolute quantification table for each sample in lipid class level (um), and the values were calculated as value/sum(values).
4. lipid_data_class_um.xlsx
This table is the absolute quantification table for each sample in lipid class level (um).

5. lipid_data_ug_ml.xlsx
This is the absolute quantification for each lipid in each sample. The unit is ug/ml.

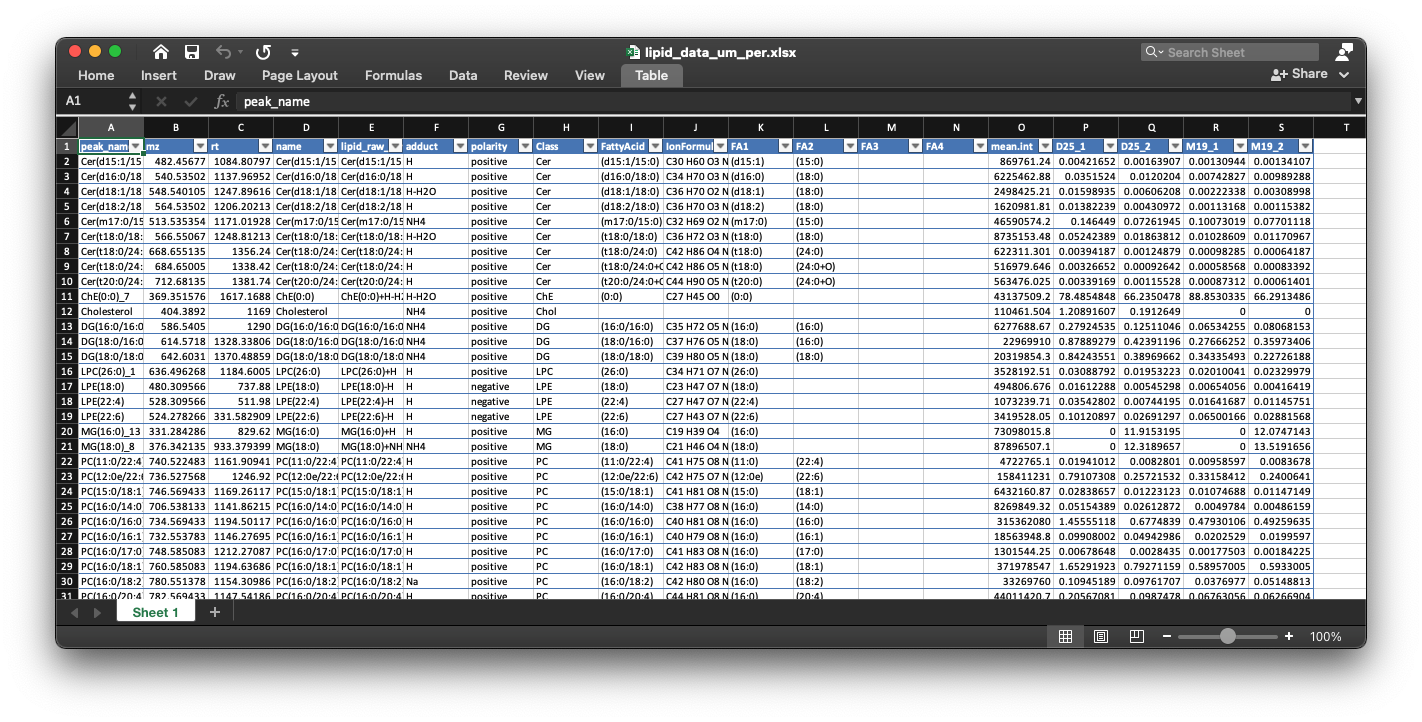
6. lipid_data_um_per.xlsx
This is the absolute quantification for each lipid in each sample. The unit is ug/ml. And the values were calculated as value/sum(values).
7. lipid_data_um.xlsx
This is the absolute quantification for each lipid in each sample. The unit is um.

8. plot_ug.pdf and plot_um.pdf
These two figures are percentage for each lipid class in each sample in ug/ml and um level.

plot_ug.pdf
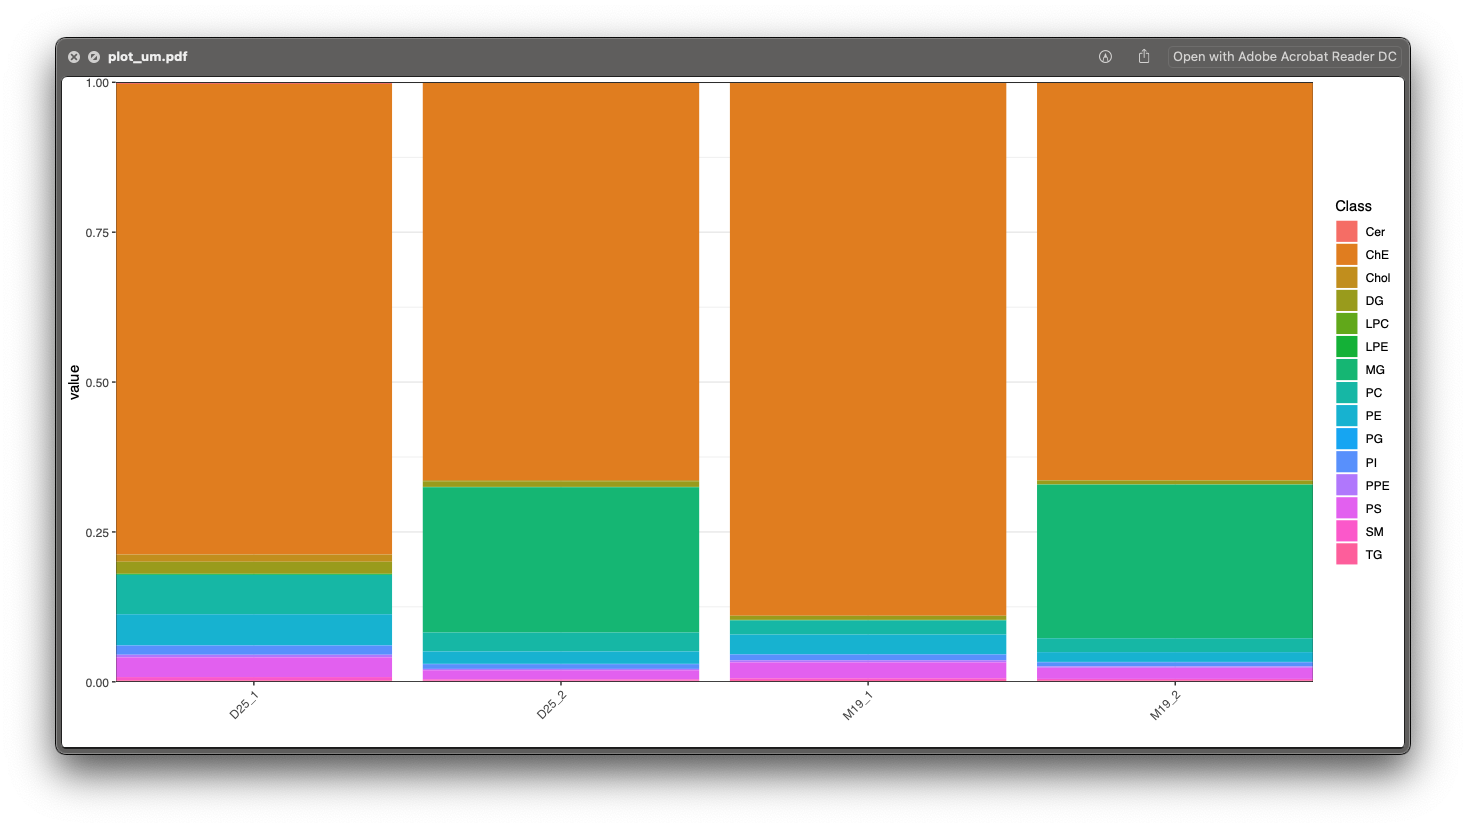
plot_um.pdf

Manually check
Next we need to check if the absolute quantification of lipids are accurate.
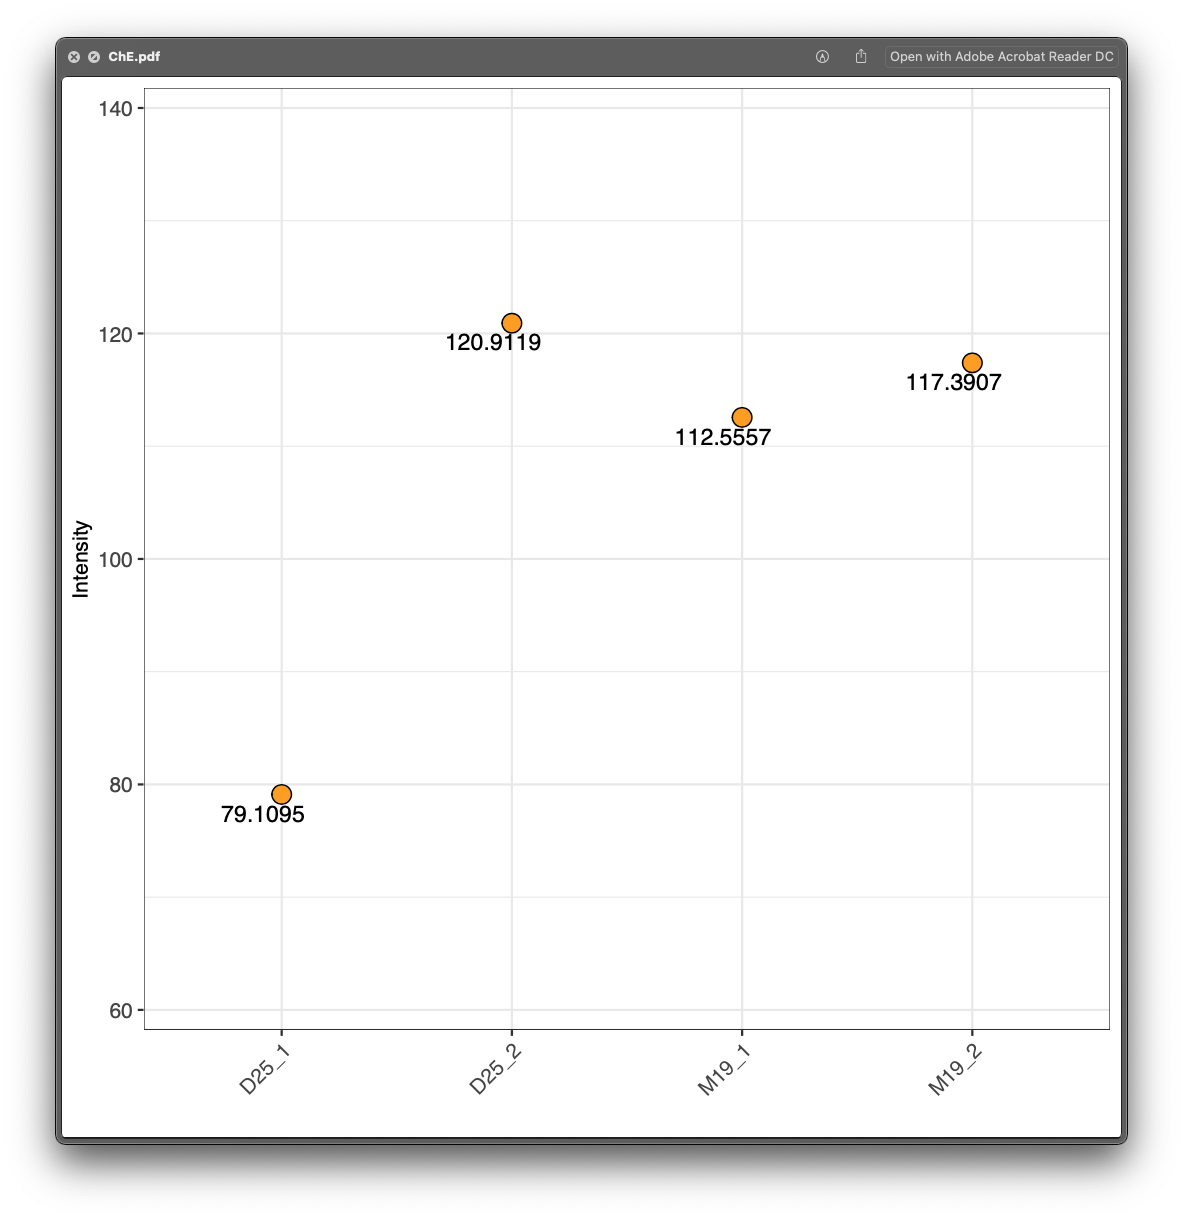
Absolute quantification in class level
First, please open the example/Result/class_plot, and check each plot. For example, for the lipid class ChE, we can see that D25_1 and D25_2 are in the sample groups, but their ChE are very different, so it indicates that the absolute quantification for ChE class may be wrong. So next we should check each lipid in ChE.
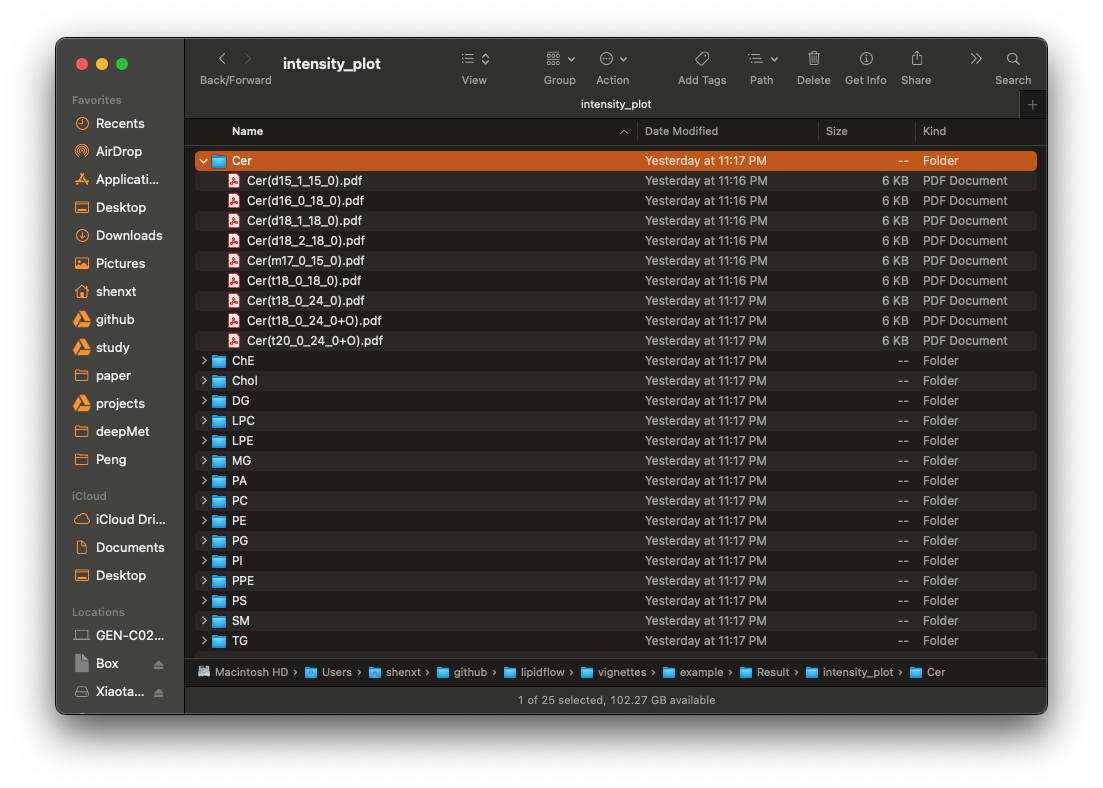
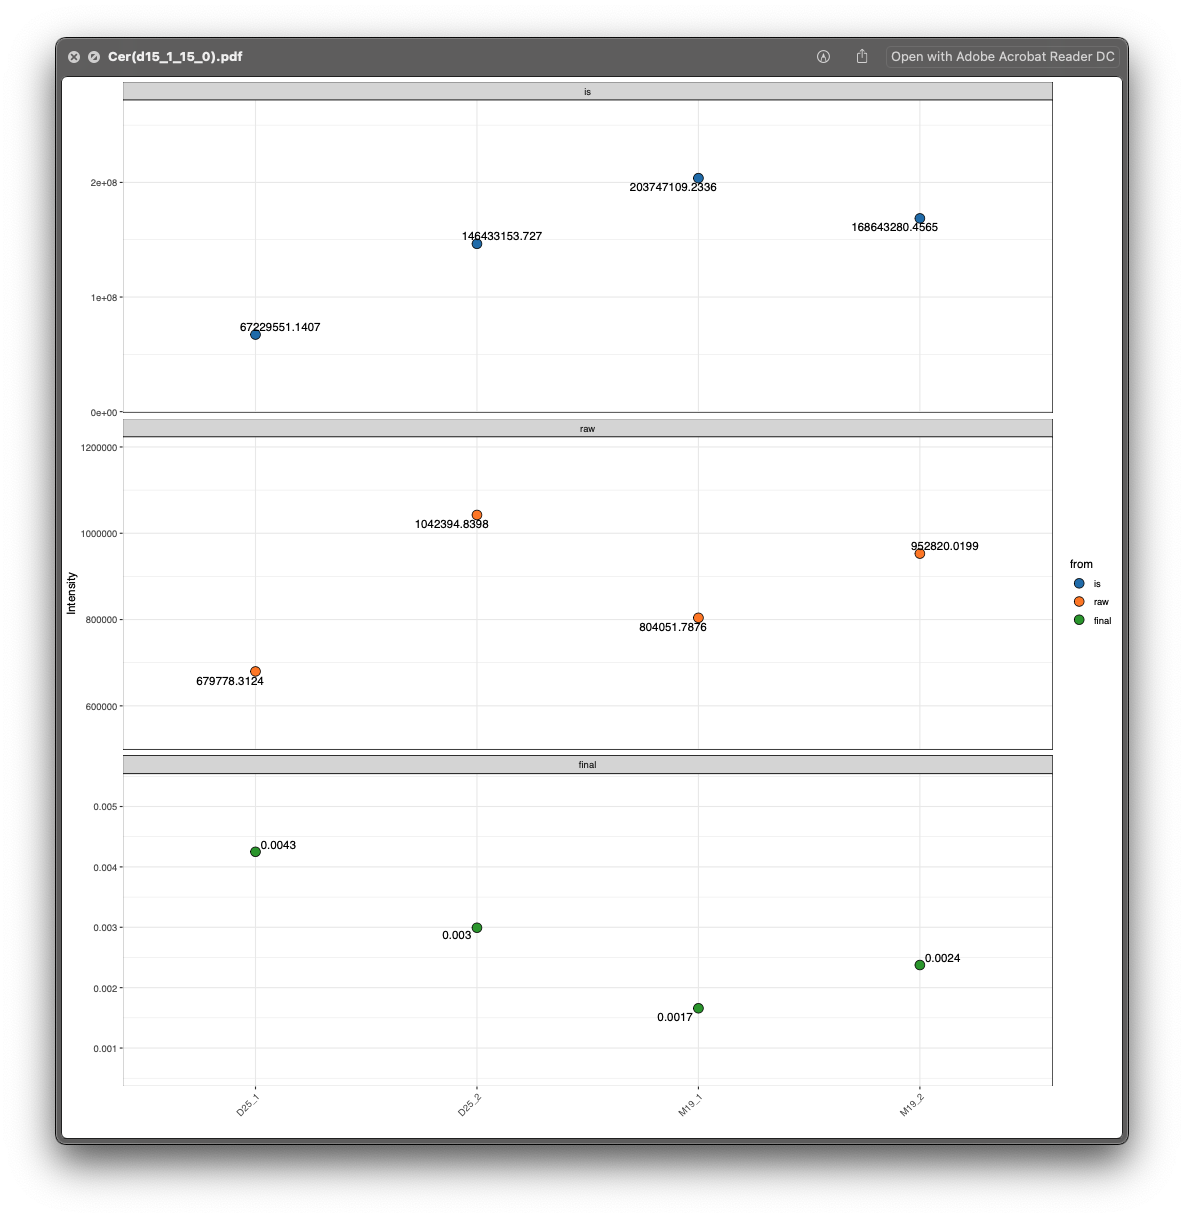
Absolute quantification in lipid level
Then open the example/Result/intensity_plot/ChE folder, and there is only one ChE lipid ChE(0_0):

From the lipid_data_um.xlsx, we know that ChE(0_0) is from positive mode, so we then open the html plot for ChE(0_0), and we can clearly see that the peak integration for D25_1 is wrong.
Rerun relative and absolute quantification data
Then we need to get the relative and absolute quantification data again.
First, open the forced_targeted_peak_table_temple.xlsx in example/POS/lipid_relative_quantification folder. And add the correct peak integration begin and end time into forced_targeted_peak_table_temple.xlsx, and rename it as forced_targeted_peak_table_temple_manual.xlsx. This step is same with Manually check for relative quantification data of internal standards in step 2. Please check the video there.
Then run the get_relative_quantification() function for lipids.
sample_info_pos = generate_sample_info(path = "example/POS")
get_relative_quantification(
  path = "example/POS",
  forced_targeted_peak_table_name = "forced_targeted_peak_table_temple_manual.xlsx",
  output_path_name = "lipid_relative_quantification",
  targeted_table_name = "lipid_annotation_table_pos.xlsx",
  sample_info = sample_info_pos,
  targeted_table_type = "lipid",
  polarity = "positive",
  output_eic = TRUE,
  ppm = 40,
  rt.tolerance = 180,
  threads = 5,
  rerun = FALSE
)
#> Manually check..
#>
#> Output peak shapes...
#> 12
#> Done
And finally we need to recalculate absolute quantification data and output and organize result. Here we can use one function organize_result() to finish all steps.
organize_result(path = "example",
                match_item_pos = match_item_pos,
                match_item_neg)
#> -------------------------------------------------------------------
#> Get absolute quantification tables...
#> -------------------------------------------------------------------
#> Positive mode.
#> 1  10  20  30  40  50  60  70  80  90  100  110  120  130  140  150  151
#> ✓ OK
#> negative mode.
#> 1  10  20  30  40  50  60
#> ✓ OK
#>
#> -------------------------------------------------------------------
#> Generate the peak plots for lipids...
#> -------------------------------------------------------------------
#> positive mode...
#> 1  2  3  4  5  6  7  8  9  10  11  12  13  14  15  16  negative mode...
#> 1  2  3  4  5  6  7  8  9  10  11  12  13  14  15  16
#> -------------------------------------------------------------------
#> Output results...
#> -------------------------------------------------------------------
#> Positive mode...
#> Cer
#> ChE
#> Chol  DG
#> LPC
#> LPE  MG
#> PA  PC
#> PE
#> PG  PI
#> PPE
#> PS
#> SM
#> TG
#>
#> Negative mode...
#> Cer  Chol  ChE  LPC  LPE
#> PC
#> PE
#> PG
#> PI
#> PPE  PS
#> SM
#> 1
#> 2
#> 3
#> 4
#> 5
#> 6
#> 7
#> 8
#> 9
#> 10
#> 11
#> 12
#> 13
#> 14
#>
#> Done.
#>
#> All done.
Then open the peak shape for ChE(0_0):
Now it is correct.