Step 1: get retention time of internal standards
Xiaotao Shen PhD (https://www.shenxt.info/)
Chuchu wang PhD
School of Medicine, Stanford UniversityCreated on 2021-02-09 and updated on 2021-03-03
Source:vignettes/get_is_retention_time.Rmd
get_is_retention_time.RmdGet retention time of internal standards
In this step, we need to get the retention time (RTs) of internal standards in samples. Here we also use the demo data from lipidflow package to show how to use it.
Data preparation
The detailed description of data preparation can be found here.
pos_data = system.file("POS", package = "lipidflow")
neg_data = system.file("NEG", package = "lipidflow")
path = file.path(".", "example")
dir.create(path)
file.copy(from = pos_data, to = path, recursive = TRUE, overwrite = TRUE)
#> [1] TRUE
file.copy(from = neg_data, to = path, recursive = TRUE, overwrite = TRUE)
#> [1] TRUE
Now there will be a example folder in your work directory. And in the example folder, there are two folders: POS and NEG. The are two groups for each mode: D25 and M19. And each group has two repeats.

We then use the get_IS_RT() function to extract the peaks for each internal standard in samples.
Extract internal standards
We need to extract internal standards for positive and negative mode, respectively.
1. Positive mode
We need to choose which class samples are used to extract internal standards. Here we use D25, so we set path as example/POS/D25 for positive mode and example/NEG/D25 for negative mode. We also need the internal standard information (xlsx format), here is IS_information.xlsx in POS and NEG folders. It should be like the below figure shows:
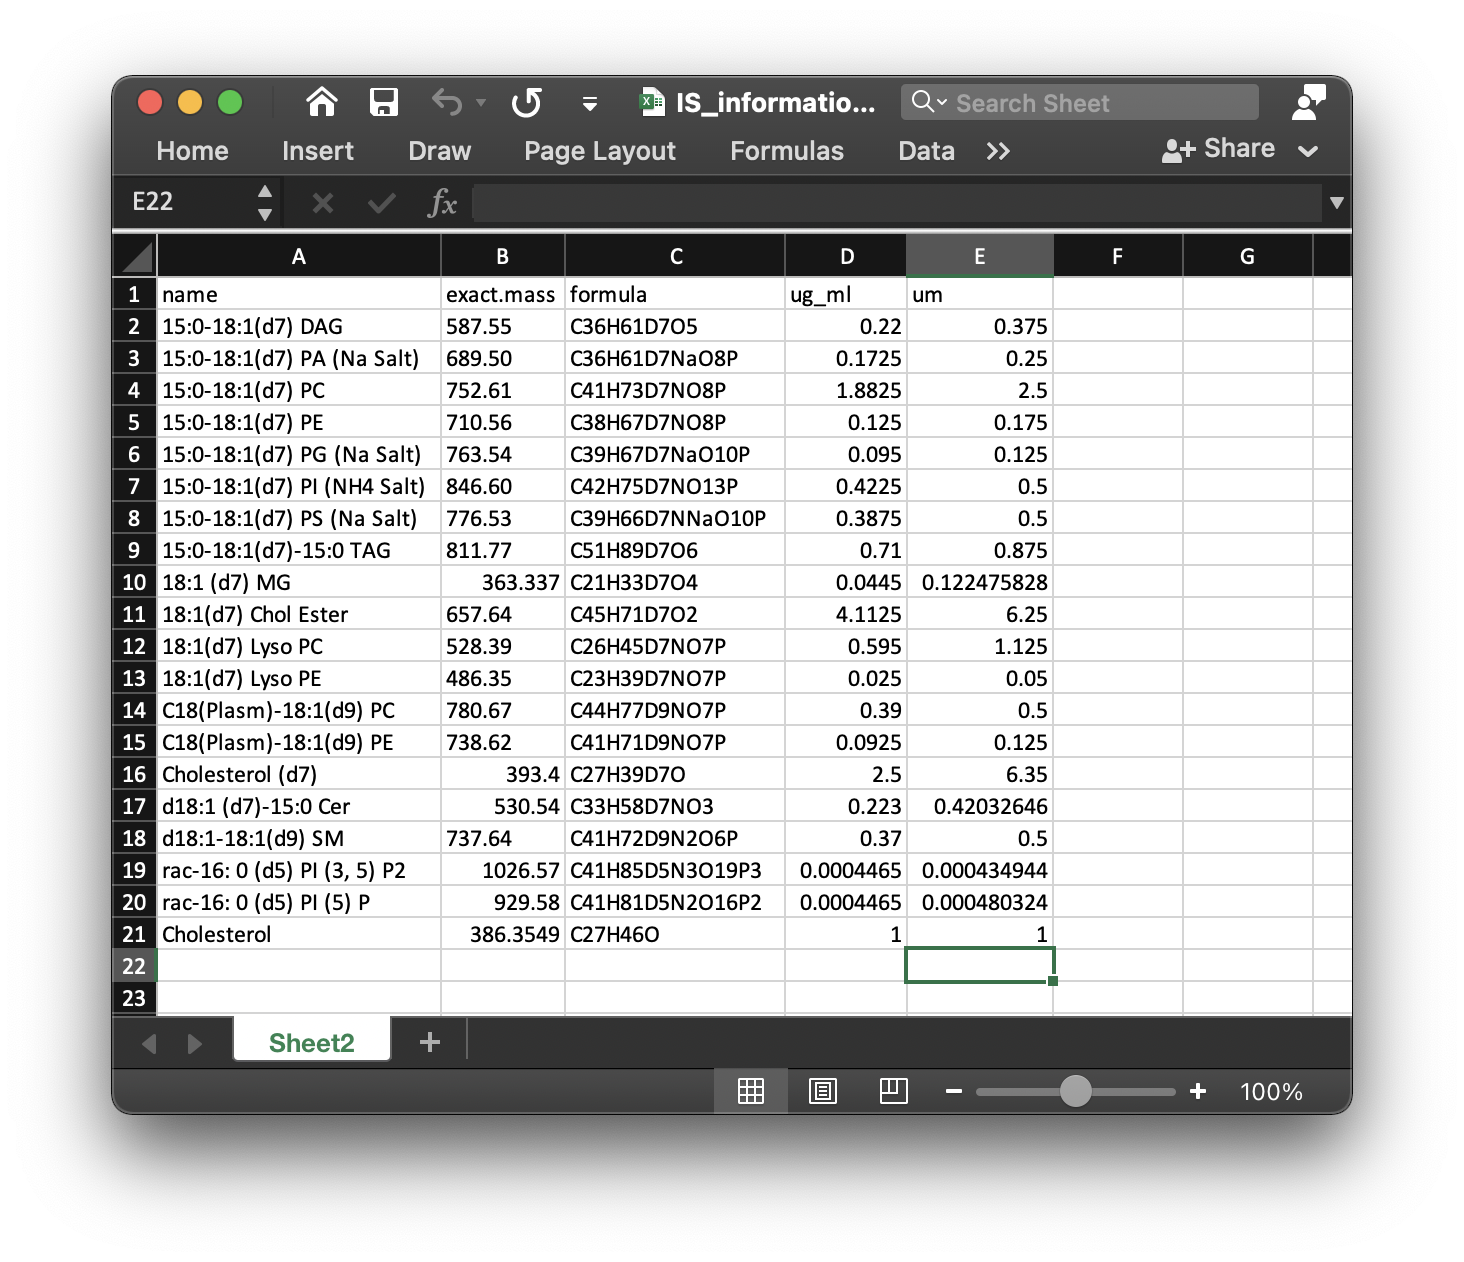 There are five columns in this table:
name: the name of internal standards.exact.mass: Exact mass.formula: Formula of internal standards.ug_ml: Concentration (ug/ul) in samples for each internal standard.um: Concentration (um) in samples for each internal standard.
Read the internal standard information table (is_info_table);
is_info_table_pos =
  readxl::read_xlsx("example/POS/IS_information.xlsx")
Then we run get_IS_RT() function to extract internal standards in POS/D25 group.
is_info_table_new_pos =
get_IS_RT(
  path = "example/POS/D25",
  is_info_table = is_info_table_pos,
  polarity = "positive",
  threads = 3,
  rerun = FALSE,
  output_eic = TRUE
)
#> Positive mode...
#>
#> Output peak shapes...
#> 1  2  3  4  5  6  7  8  9  10  11  12  13  14  15  16  17  18  19  20  21  22  23  24  25  26  27  28  29  30  31  32  33  34  35  36  37  38  39  40  41  42  43  44  45  46  47  48  49  50  51  52  53  54  55  56  57  58  59  60  61  62  63  64  65  66  67  68  69  70  71  72  73  74  75  76  77  78  79  80  81
#> Done
The parameters of get_IS_RT():
path: The folder containsD25samples.is_info_table: The internal standard information.polarity: “positive” or “negative”.threads: The number of cores to run.rerun: If you setrerunasFALSE, then the peak detection will nor be rerun.output_eic: Output EIC or not.
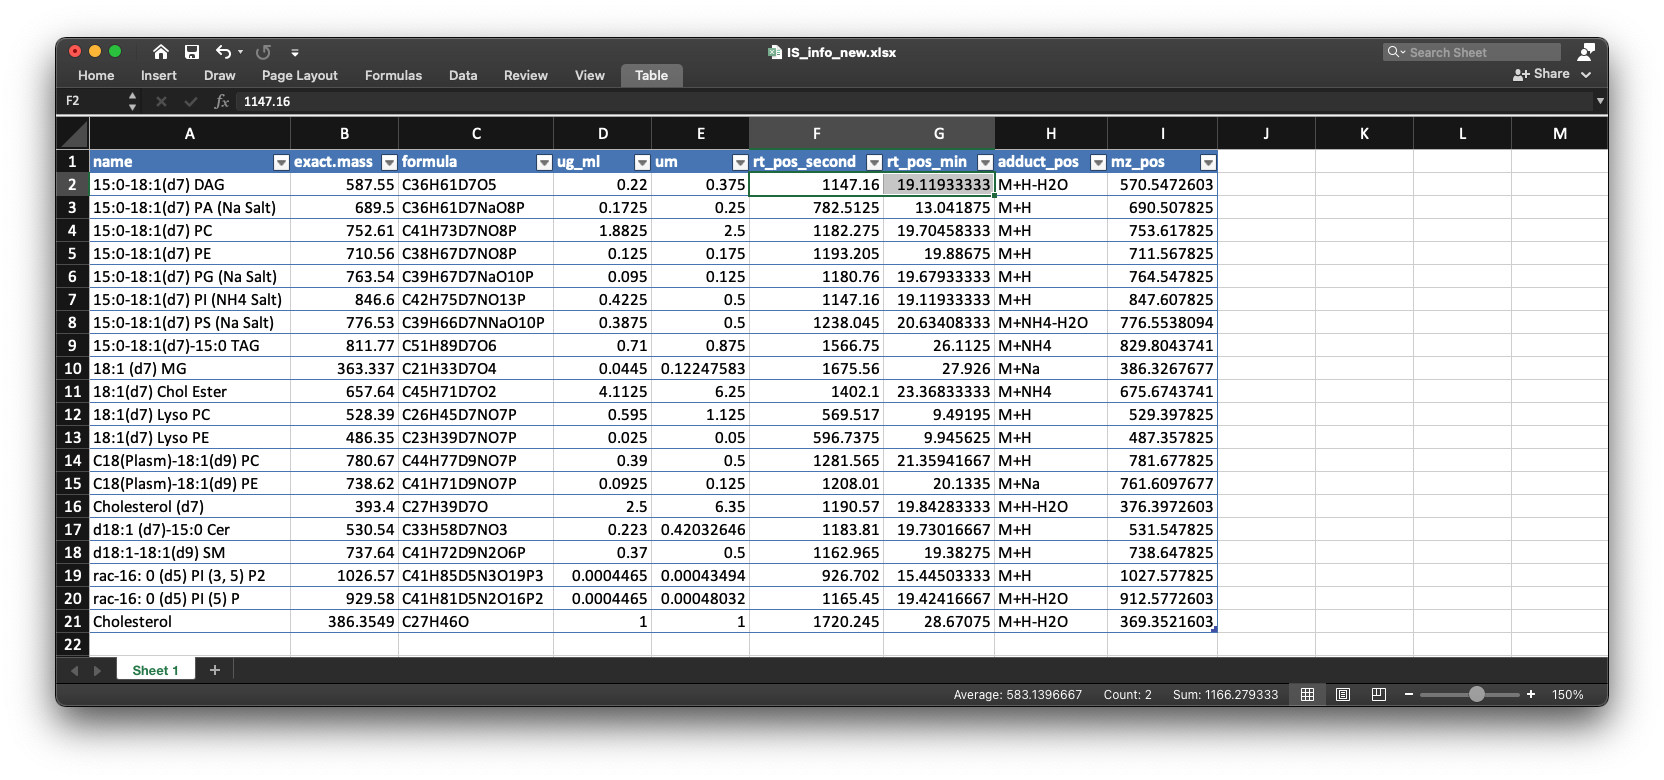
The is_info_table_new_pos is the table which has been added the information of internal standards:
head(is_info_table_new_pos)
#> # A tibble: 6 x 9
#>   name  exact.mass formula ug_ml    um rt_pos_second rt_pos_min adduct_pos
#>   <chr>      <dbl> <chr>   <dbl> <dbl>         <dbl>      <dbl> <chr>
#> 1 15:0…       588. C36H61… 0.22  0.375         1147.       19.1 M+H-H2O
#> 2 15:0…       690. C36H61… 0.172 0.25           783.       13.0 M+H
#> 3 15:0…       753. C41H73… 1.88  2.5           1182.       19.7 M+H
#> 4 15:0…       711. C38H67… 0.125 0.175         1193.       19.9 M+H
#> 5 15:0…       764. C39H67… 0.095 0.125         1181.       19.7 M+H
#> 6 15:0…       847. C42H75… 0.422 0.5           1147.       19.1 M+H
#> # … with 1 more variable: mz_pos <dbl>
We then output the table into local folder:
openxlsx::write.xlsx(
  is_info_table_new_pos,
  file = "example/POS/IS_info_new.xlsx",
  asTable = TRUE
)
2. Negative mode
Negative mode is same with positive mode.
is_info_table_neg =
  readxl::read_xlsx("example/NEG/IS_information.xlsx")

is_info_table_new_neg =
get_IS_RT(
  path = "example/NEG/D25",
  is_info_table = is_info_table_neg,
  polarity = "negative",
  threads = 3,
  rerun = FALSE,
  output_eic = TRUE
)
#> Negative mode...
#>
#> Output peak shapes...
#> 1  2  3  4  5  6  7  8  9  10  11  12  13  14  15  16  17  18  19  20  21  22  23  24  25  26  27  28  29  30
#> Done

openxlsx::write.xlsx(
  is_info_table_new_neg,
  file = "example/NEG/IS_info_new.xlsx",
  asTable = TRUE
)
Manually check
Because the adduct, retention time of internal standards are automatically selected, so some of them maybe wrong, so lipidflow output the peak shapes for each internal standards. And one table is also generated to know which adduct is should be checked first. The table name is in the example/POS/D25/Result, the table name is IS_RT_table_for_check.xlsx.

For this internal standard (15:0-18:1(d7) DAG), we should first check its M+H-H2O. So open the example/POS/D25/Result/peak_shape folder, and then open 15_0-18_1_d7_ DAG_M+H-H2O.html. Like below figure shows:
We can see that this compound has two peaks, so we can open another adduct (M+H) of this internal standard:
We can see that the retention time is around 1267 second, so we can change the retention time in the example/POS/IS_info_new.xlsx.
After you change the information of internal standards in IS_info_new.xlsx for positive and negative modes, respectively, then the new IS_info_new.xlsx will be used for next step