One function to finish all steps
Xiaotao Shen PhD (https://www.shenxt.info/)
Chuchu wang PhD
School of Medicine, Stanford UniversityCreated on 2021-02-09 and updated on 2021-03-03
Source:vignettes/one_step_of_lipidflow.Rmd
one_step_of_lipidflow.Rmdlipidflow also provide only one function get_lipid_absolute_quantification() to finish all steps (step 1-4).
Demo data to show how to use get_lipid_absolute_quantification()
Organize the demo data
First, we need to get the demo dataset.
library(lipidflow)
library(tidyverse)
pos_data = system.file("POS", package = "lipidflow")
neg_data = system.file("NEG", package = "lipidflow")
path = file.path(".", "example")
dir.create(path)
file.copy(from = pos_data, to = path, recursive = TRUE, overwrite = TRUE)
#> [1] TRUE
file.copy(from = neg_data, to = path, recursive = TRUE, overwrite = TRUE)
#> [1] TRUE
Now there will be a example folder in your work directory. And in the example folder, there are two folders: POS and NEG. The are two groups for each mode: “D25” and “M19”. And each group has two repeats.

Next, we should set the match list between internal standards and lipid class.
- Positive mode:
match_item_pos =
  list(
    "Cer" = "d18:1 (d7)-15:0 Cer",
    "ChE" = c("18:1(d7) Chol Ester", "Cholesterol (d7)"),
    "Chol" = "Cholesterol (d7)",
    "DG" = "15:0-18:1(d7) DAG",
    "LPC" = "18:1(d7) Lyso PC",
    "LPE" = "18:1(d7) Lyso PE",
    "MG" = "18:1 (d7) MG",
    "PA" = "15:0-18:1(d7) PA (Na Salt)",
    "PC" = "15:0-18:1(d7) PC",
    "PE" = "15:0-18:1(d7) PE",
    "PG" = "15:0-18:1(d7) PG (Na Salt)",
    "PI" = "15:0-18:1(d7) PI (NH4 Salt)",
    "PPE" = "C18(Plasm)-18:1(d9) PE",
    "PS" = "15:0-18:1(d7) PS (Na Salt)",
    "SM" = "d18:1-18:1(d9) SM",
    "TG" = "15:0-18:1(d7)-15:0 TAG"
)- Negative mode:
match_item_neg =
  list(
    "Cer" = "d18:1 (d7)-15:0 Cer",
    "Chol" = "Cholesterol (d7)",
    "ChE" = c("18:1(d7) Chol Ester", "Cholesterol (d7)"),
    "LPC" = "18:1(d7) Lyso PC",
    "LPE" = "18:1(d7) Lyso PE",
    "PC" = "15:0-18:1(d7) PC",
    "PE" = "15:0-18:1(d7) PE",
    "PG" = "15:0-18:1(d7) PG (Na Salt)",
    "PI" = "15:0-18:1(d7) PI (NH4 Salt)",
    "PPE" = "C18(Plasm)-18:1(d9) PE",
    "PS" = "15:0-18:1(d7) PS (Na Salt)",
    "SM" = "d18:1-18:1(d9) SM"
  )
Run get_lipid_absolute_quantification() function
Then we run get_lipid_absolute_quantification() function. Please note that path need to set as example.
get_lipid_absolute_quantification(
  path = "example",
  is_info_name_pos = "IS_information.xlsx",
  is_info_name_neg = "IS_information.xlsx",
  use_manual_is_info = FALSE,
  lipid_annotation_table_pos = "lipid_annotation_table_pos.xlsx",
  lipid_annotation_table_neg = "lipid_annotation_table_neg.xlsx",
  output_eic = TRUE,
  ppm = 40,
  rt.tolerance = 180,
  threads = 3,
  rerun = FALSE,
  which_group_for_rt_confirm = "D25",
  match_item_pos = match_item_pos,
  match_item_neg = match_item_neg
)
#> -------------------------------------------------------------------
#> Get retention times of all Internal standards...
#> -------------------------------------------------------------------
#> Positive mode...
#>
#> Output peak shapes...
#> 1  2  3  4  5  6  7  8  9  10  11  12  13  14  15  16  17  18  19  20  21  22  23  24  25  26  27  28  29  30  31  32  33  34  35  36  37  38  39  40  41  42  43  44  45  46  47  48  49  50  51  52  53  54  55  56  57  58  59  60  61  62  63  64  65  66  67  68  69  70  71  72  73  74  75  76  77  78  79  80  81
#> Done
#> Negative mode...
#>
#> Output peak shapes...
#> 1  2  3  4  5  6  7  8  9  10  11  12  13  14  15  16  17  18  19  20  21  22  23  24  25  26  27  28  29  30
#> Done
#> -------------------------------------------------------------------
#> Get relative quantification tables...
#> -------------------------------------------------------------------
#> Internal standard positive mode...
#>
#> Output peak shapes...
#> 1  2  3  4  5  6  7  8  9  10  11  12  13  14  15  16  17  18  19
#> Done
#>
#> Lipid positive mode...
#>
#> Output peak shapes...
#> 1  2  3  4  5  6  7  8  9  10  11  12  13  14  15  16  17  18  19  20  21  22  23  24  25  26  27  28  29  30  31  32  33  34  35  36  37  38  39  40  41  42  43  44  45  46  47  48  49  50  51  52  53  54  55  56  57  58  59  60  61  62  63  64  65  66  67  68  69  70  71  72  73  74  75  76  77  78  79  80  81  82  83  84  85  86  87  88  89  90  91  92  93  94  95  96  97  98  99  100  101  102  103  104  105  106  107  108  109  110  111  112  113  114  115  116  117  118  119  120  121  122  123  124  125  126  127  128  129  130  131  132  133  134  135  136  137  138  139  140  141  142  143  144  145  146  147  148  149  150  151  152  153  154  155  156  157  158  159  160  161  162  163  164  165  166  167  168  169  170  171  172  173  174  175  176  177
#> Done
#>
#> Internal standard negative mode...
#>
#> Output peak shapes...
#> 1  2  3  4  5  6  7  8  9  10  11  12  13  14  15
#> Done
#>
#> Lipid negative mode...
#>
#> Output peak shapes...
#> 1  2  3  4  5  6  7  8  9  10  11  12  13  14  15  16  17  18  19  20  21  22  23  24  25  26  27  28  29  30  31  32  33  34  35  36  37  38  39  40  41  42  43  44  45  46  47  48  49  50  51  52  53  54  55  56  57  58  59  60  61
#> Done
#>
#> -------------------------------------------------------------------
#> Get absolute quantification tables...
#> -------------------------------------------------------------------
#> Positive mode.
#> 1  10  20  30  40  50  60  70  80  90  100  110  120  130  140  150  151
#> ✓ OK
#> negative mode.
#> 1  10  20  30  40  50  60
#> ✓ OK
#>
#> -------------------------------------------------------------------
#> Generate the peak plots for lipids...
#> -------------------------------------------------------------------
#> positive mode...
#> 1  2  3  4  5  6  7  8  9  10  11  12  13  14  15  16  negative mode...
#> 1  2  3  4  5  6  7  8  9  10  11  12  13  14  15  16
#> -------------------------------------------------------------------
#> Output results...
#> -------------------------------------------------------------------
#> Positive mode...
#> Cer
#> ChE
#> Chol  DG
#> LPC
#> LPE  MG
#> PA  PC
#> PE
#> PG  PI
#> PPE
#> PS
#> SM
#> TG
#>
#> Negative mode...
#> Cer  Chol  ChE  LPC  LPE
#> PC
#> PE
#> PG
#> PI
#> PPE  PS
#> SM
#> 1
#> 2
#> 3
#> 4
#> 5
#> 6
#> 7
#> 8
#> 9
#> 10
#> 11
#> 12
#> 13
#> 14
#>
#> Done.
#>
#> All done.
Manually check for relative quantification data of internal standards
Sometimes, the peak detection maybe not accurate, so we need to manually check the peak shape of all the internal standards and then detect peak and integrate peak shape again.
For example, the internal standard 18_1_d7_ Lyso PC in positive mode (example/POS/is_relative_quantification/peak_shape/18_1_d7_ Lyso PC.html), the peak shape is like below figure shows:
From this figure, we can see that for the samples D25_1, D25_2 and M19_2, the integrate region (begin point) is not correct, so we need to manually correct that.
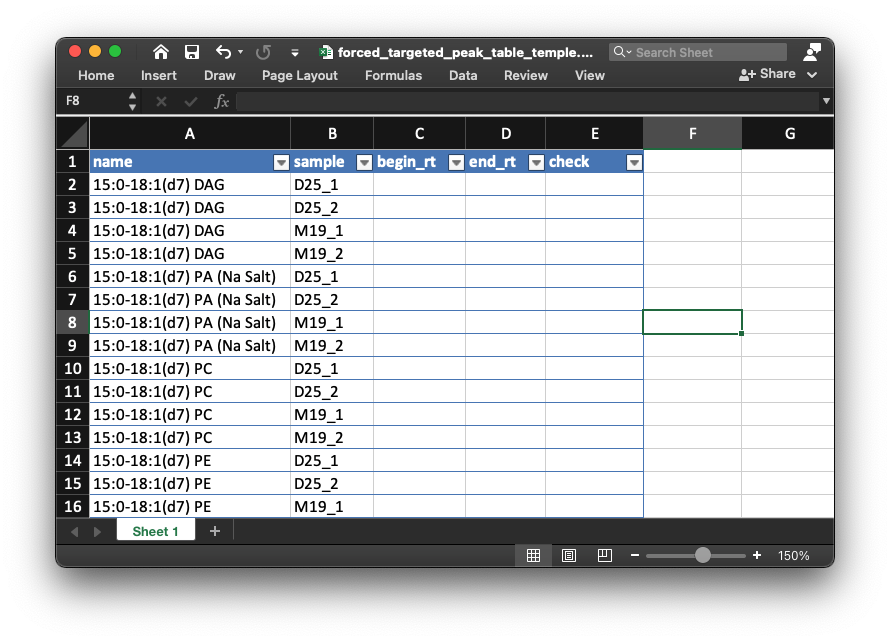
- Open the table in
example/POS/is_relative_quantification/forced_targeted_peak_table_temple.xlsx, like the below figure shows:
- Then open the peak shape plot for each internal standard in
example/POS/is_relative_quantification/peak_shape. Then if you find that the peak integration is not correct, you can add the right begin and end retention time for peaks like below video shows:
After check all the internal standards which are not normal, please rename it as forced_targeted_peak_table_temple_manual.xlsx and rerun get_relative_quantification(), and note that set forced_targeted_peak_table_name as forced_targeted_peak_table_temple_manual.xlsx:
For the negative mode, we can also manually check internal standards like this and rerun to get more accurate peak integration and relative quantification data.
Manually check for absolute quantification data of lipids
Absolute quantification in class level
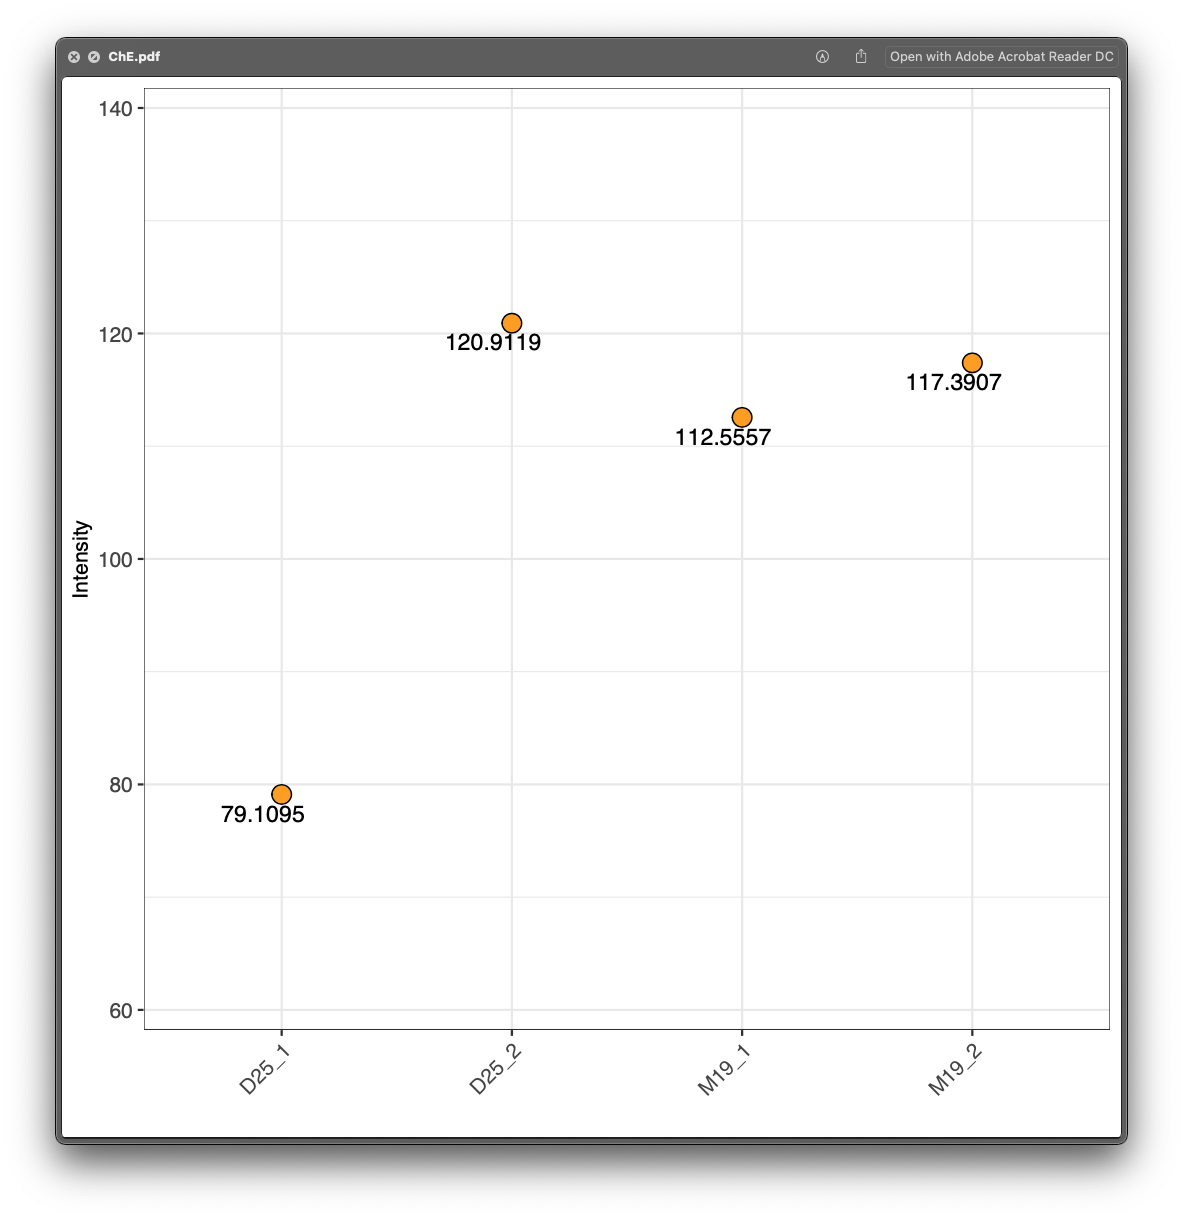
First, please open the example/Result/class_plot, and check each plot. For example, for the lipid class ChE, we can see that D25_1 and D25_2 are in the sample groups, but their ChE are very different, so it indicates that the absolute quantification for ChE class may be wrong. So next we should check each lipid in ChE.
Absolute quantification in lipid level
Then open the example/Result/intensity_plot/ChE folder, and there is only one ChE lipid ChE(0_0):

From the lipid_data_um.xlsx, we know that ChE(0_0) is from positive mode, so we then open the html plot for ChE(0_0), and we can clearly see that the peak integration for D25_1 is wrong.
Rerun get_lipid_absolute_quantification()
Then we need to get the relative and absolute quantification data again.
First, open the forced_targeted_peak_table_temple.xlsx in example/POS/lipid_relative_quantification folder. And add the correct peak integration begin and end time into forced_targeted_peak_table_temple.xlsx, and rename it as forced_targeted_peak_table_temple_manual.xlsx. This step is same with Manually check for relative quantification data of internal standards in step 2. Please check the video there.
Then run the get_relative_quantification() function for lipids.
get_lipid_absolute_quantification(
  path = "example",
  forced_targeted_peak_table_name = "forced_targeted_peak_table_temple_manual.xlsx",
  is_info_name_pos = "IS_information.xlsx",
  is_info_name_neg = "IS_information.xlsx",
  lipid_annotation_table_pos = "lipid_annotation_table_pos.xlsx",
  lipid_annotation_table_neg = "lipid_annotation_table_neg.xlsx",
  output_eic = TRUE,
  ppm = 40,
  rt.tolerance = 180,
  threads = 3,
  rerun = FALSE,
  which_group_for_rt_confirm = "D25",
  match_item_pos = match_item_pos,
  match_item_neg = match_item_neg
)
#> -------------------------------------------------------------------
#> Get retention times of all Internal standards...
#> -------------------------------------------------------------------
#> Positive mode...
#>
#> Output peak shapes...
#> 1  2  3  4  5  6  7  8  9  10  11  12  13  14  15  16  17  18  19  20  21  22  23  24  25  26  27  28  29  30  31  32  33  34  35  36  37  38  39  40  41  42  43  44  45  46  47  48  49  50  51  52  53  54  55  56  57  58  59  60  61  62  63  64  65  66  67  68  69  70  71  72  73  74  75  76  77  78  79  80  81
#> Done
#> Negative mode...
#>
#> Output peak shapes...
#> 1  2  3  4  5  6  7  8  9  10  11  12  13  14  15  16  17  18  19  20  21  22  23  24  25  26  27  28  29  30
#> Done
#> -------------------------------------------------------------------
#> Get relative quantification tables...
#> -------------------------------------------------------------------
#> Internal standard positive mode...
#> Manually check..
#>
#> Output peak shapes...
#> 10
#> Done
#>
#> Lipid positive mode...
#> Manually check..
#>
#> Output peak shapes...
#> 12
#> Done
#>
#> Internal standard negative mode...
#> Lipid negative mode...
#> -------------------------------------------------------------------
#> Get absolute quantification tables...
#> -------------------------------------------------------------------
#> Positive mode.
#> 1  10  20  30  40  50  60  70  80  90  100  110  120  130  140  150  151
#> ✓ OK
#> negative mode.
#> 1  10  20  30  40  50  60
#> ✓ OK
#>
#> -------------------------------------------------------------------
#> Generate the peak plots for lipids...
#> -------------------------------------------------------------------
#> positive mode...
#> 1  2  3  4  5  6  7  8  9  10  11  12  13  14  15  16  negative mode...
#> 1  2  3  4  5  6  7  8  9  10  11  12  13  14  15  16
#> -------------------------------------------------------------------
#> Output results...
#> -------------------------------------------------------------------
#> Positive mode...
#> Cer
#> ChE
#> Chol  DG
#> LPC
#> LPE  MG
#> PA  PC
#> PE
#> PG  PI
#> PPE
#> PS
#> SM
#> TG
#>
#> Negative mode...
#> Cer  Chol  ChE  LPC  LPE
#> PC
#> PE
#> PG
#> PI
#> PPE  PS
#> SM
#> 1
#> 2
#> 3
#> 4
#> 5
#> 6
#> 7
#> 8
#> 9
#> 10
#> 11
#> 12
#> 13
#> 14
#>
#> Done.
#>
#> All done.
Then open the peak shape for ChE(0_0):
Now it is correct.