Calculate lagged correlation between two time-series data
Xiaotao Shen (https://www.shenxt.info/)
Created on 2021-12-25 and updated on 2023-09-08
lagged_correlation.RmdData preparation
laggedcor needs two time-series data and their
corresponding time.
x: time-series 1. numeric vector.
y: time-series 2. numeric vector.
time1: time for x.
time2: time for y.
The demo data can be from laggedcor.
library(laggedcor)
data("step_data", package = "laggedcor")
data("heart_data", package = "laggedcor")

head(step_data)
#>                  time step
#> 1 2019-04-29 00:00:00    0
#> 2 2019-04-29 00:01:00    0
#> 3 2019-04-29 00:02:00    0
#> 4 2019-04-29 00:03:00    0
#> 5 2019-04-29 00:04:00    0
#> 6 2019-04-29 00:05:00    0
head(heart_data)
#>                  time heart
#> 1 2019-04-29 00:00:08    64
#> 2 2019-04-29 00:00:13    65
#> 3 2019-04-29 00:00:18    66
#> 4 2019-04-29 00:00:23    65
#> 5 2019-04-29 00:00:33    64
#> 6 2019-04-29 00:00:38    61
time_plot(x = step_data$step, time = step_data$time)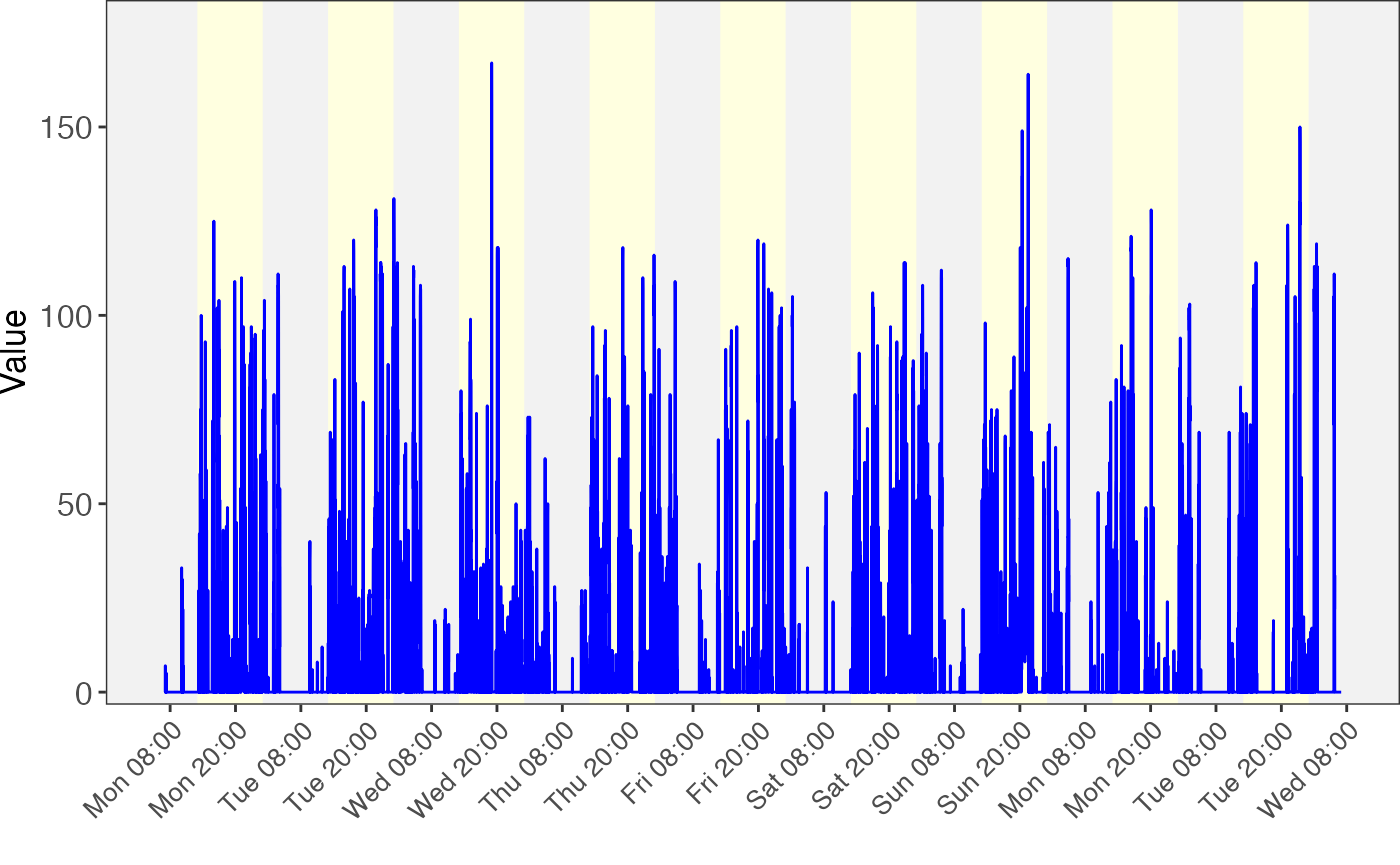
time_plot(x = heart_data$heart, time = heart_data$time)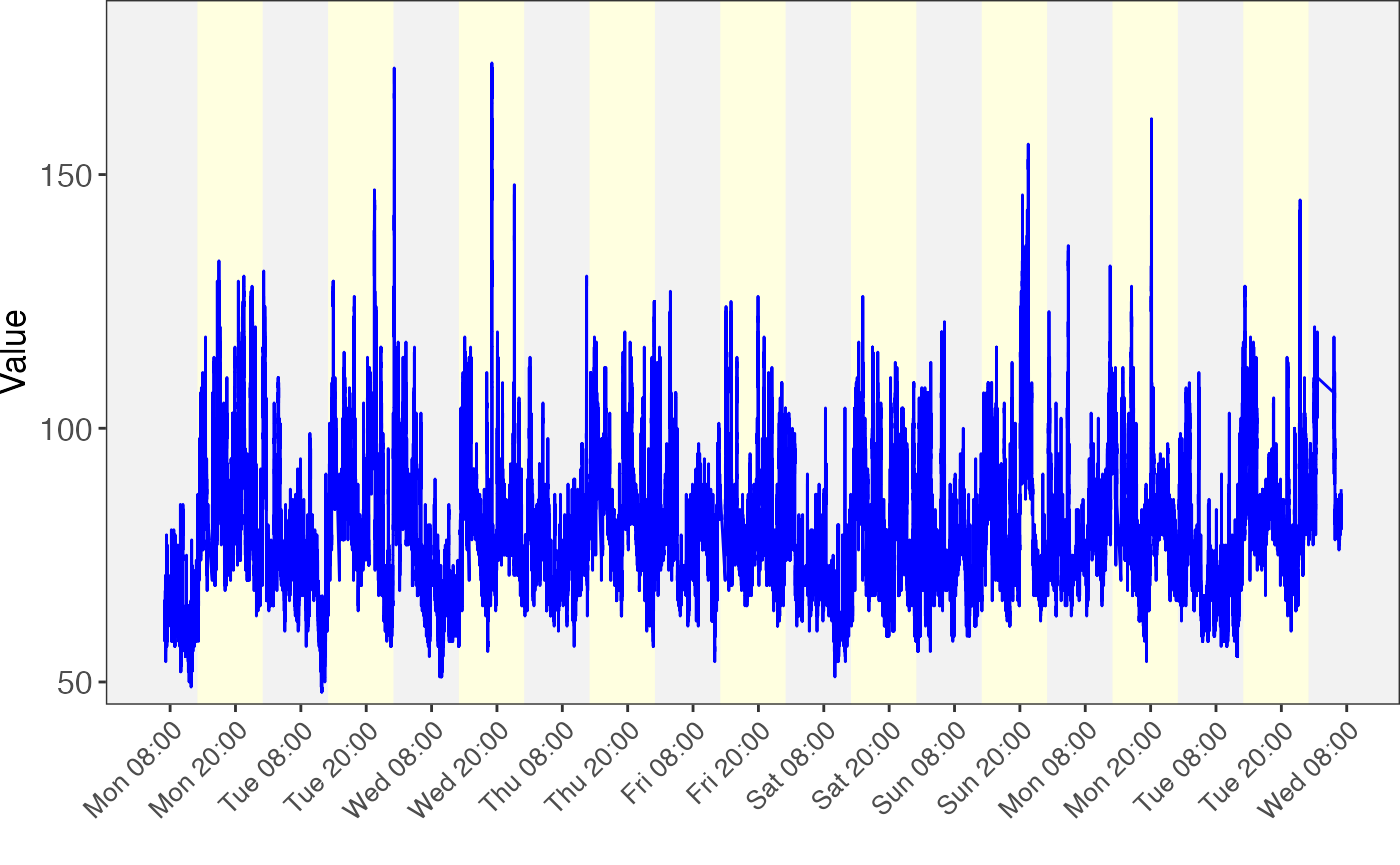
Calculate lagged correlation
Then we calculate the lagged correlations between step and heart rate.
The time-series data with less number of time point should be set as
x.
x = step_data$step
time1 = step_data$time

y = heart_data$heart
time2 = heart_data$time
result =
calculate_lagged_correlation(x = x,
y = y,
time1 = time1,
time2 = time2,
time_tol = 0.2,
step = 2 / 60,
min_matched_sample = 10,
threads = 5,
cor_method = "spearman")
#>
|
| | 0%
|
|====== | 9%
|
|============= | 18%
|
|=================== | 27%
|
|========================= | 36%
|
|================================ | 45%
|
|====================================== | 55%
|
|============================================= | 64%
|
|=================================================== | 73%
|
|========================================================= | 82%
|
|================================================================ | 91%
|
|======================================================================| 100%The parameters of calculate_lagged_correlation;
x: time-series data 1.y: time-series data 2.time1: time-series data time 1.time2: time-series data time 2.time_tol: time tolerance for time shift. Unit is hour. 0.2 means ± 0.2 hour.step: step means the matching window, unit is hour.min_matched_sample: Minimum for match sample number.threads: thread number.cor_method: spearman or pearson.
Result of lagged correlation
result
#> --------------------
#> Brief information
#> Shift time is x - y
#> If shift time > 0:
#> means that x is changing after y
#> If shift time < 0:
#> means that x is changing before y
#> --------------------
#> length of x: 12960
#> length of y: 91948
#> length of correlations: 11
#> length of correlations: 11
#> Max correlation index: 5
#> Global correlation index: 6
#> --------------------
#> Parameters
#> --------------------
#> pacakge_name: laggedcor
#> function_name: calculate_lagged_correlation
#> time: 2023-09-08 11:24:32.983307
#> parameters:
#> time_tol : 0.2
#> step : 0.0333333333333333
#> min_matched_sample : 10
#> progressbar : TRUE
#> threads : 5
#> cor_method : spearman
We can see that the index of max correlation is 11 and index of global correlation is 12, means that the max correlation is achieved from a shifted time.
Result of lagged correlation
extract_max_cor(object = result)
#> (-3,-1]
#> 0.5848359
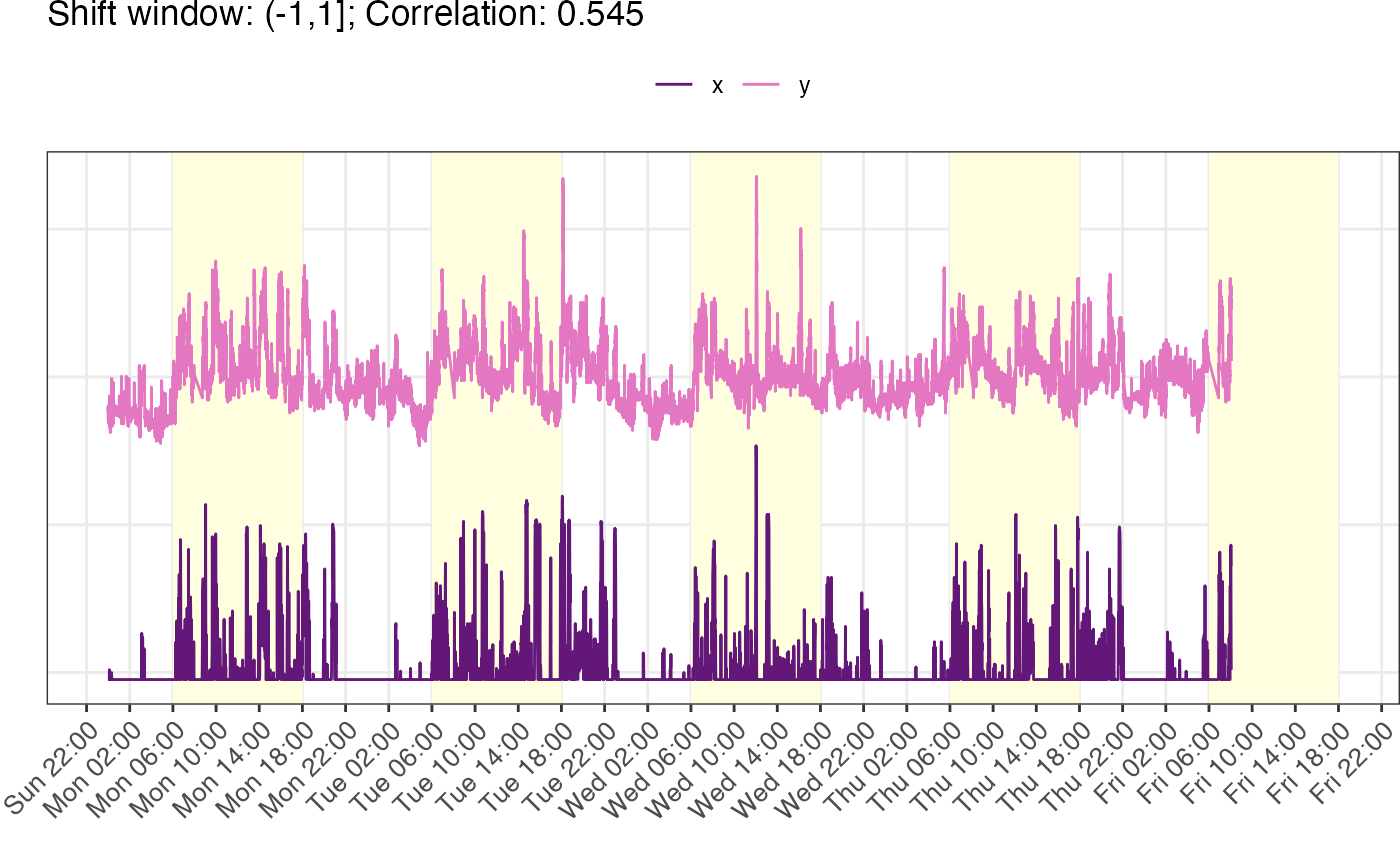
extract_global_cor(object = result)
#> (-1,1]
#> 0.5446995We can see that when the shift time is “(-1.5,-0.5]”, we get the max correaltion: 0.58. This means x (step) changes before y (heart rate).
extract_all_cor(result)
#>  (-11,-9]   (-9,-7]   (-7,-5]   (-5,-3]   (-3,-1]    (-1,1]     (1,3]     (3,5]
#> 0.3881415 0.4272695 0.4677489 0.5286853 0.5848359 0.5446995 0.4711800 0.4246677
#>     (5,7]     (7,9]    (9,11]
#> 0.3836658 0.3447499 0.3161717
extract_all_cor_p(result)
#>      (-11,-9]       (-9,-7]       (-7,-5]       (-5,-3]       (-3,-1]
#>  0.000000e+00  0.000000e+00  0.000000e+00  0.000000e+00  0.000000e+00
#>        (-1,1]         (1,3]         (3,5]         (5,7]         (7,9]
#>  0.000000e+00  0.000000e+00  0.000000e+00  0.000000e+00  0.000000e+00
#>        (9,11]
#> 3.205407e-287
extract_shift_time(result, numeric = TRUE)
#>  [1] -10  -8  -6  -4  -2   0   2   4   6   8  10
extract_shift_time(result, numeric = FALSE)
#>  [1] "(-11,-9]" "(-9,-7]"  "(-7,-5]"  "(-5,-3]"  "(-3,-1]"  "(-1,1]"
#>  [7] "(1,3]"    "(3,5]"    "(5,7]"    "(7,9]"    "(9,11]"
Evaluate the quality of lagged correlation
evaluate_lagged_cor(object = result, plot = TRUE)
#> $score
#> [1] 0.9973992
#>
#> $plot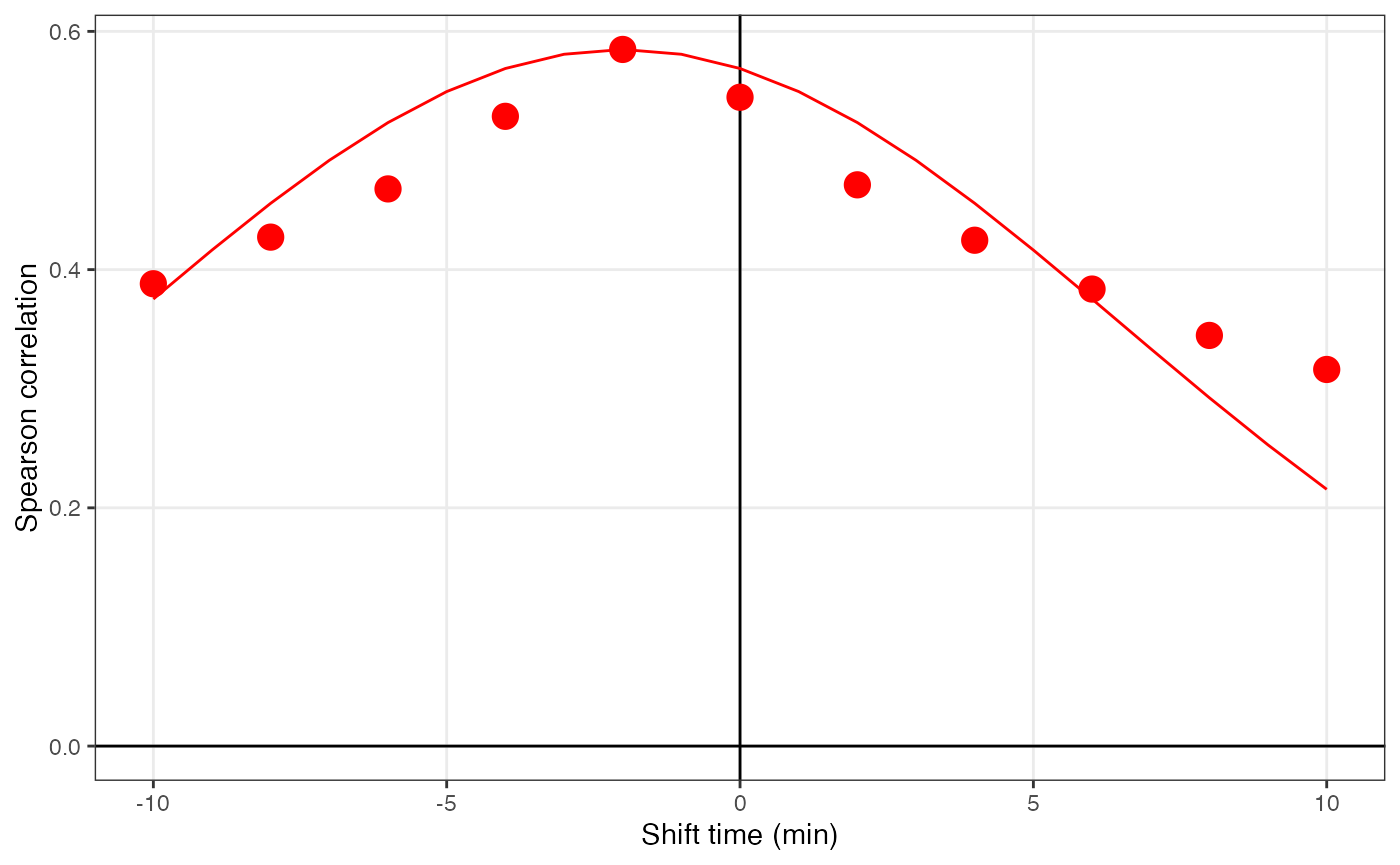
Some results
lagged_scatter_plot(object = result, hex = TRUE, which = "global")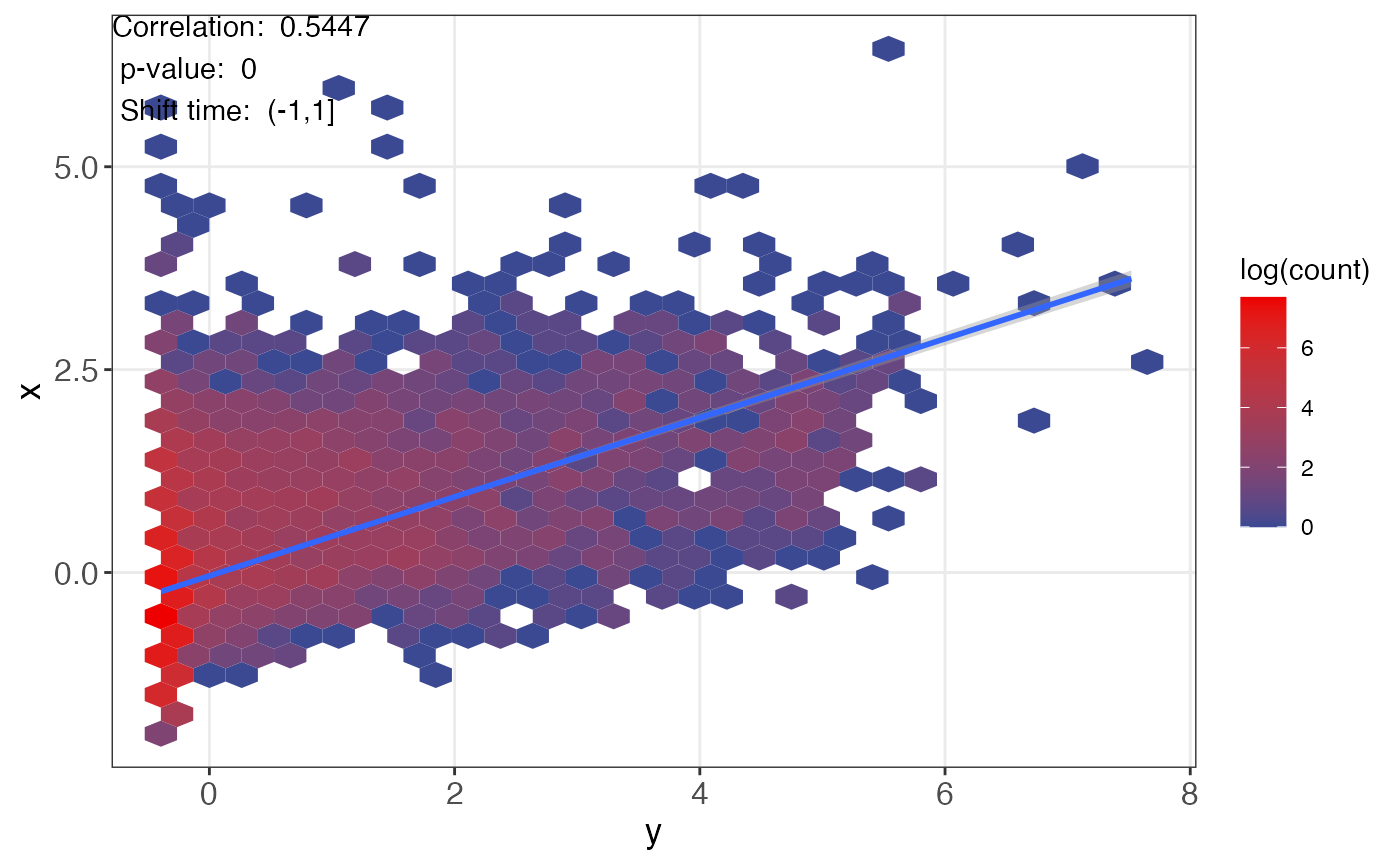
lagged_scatter_plot(object = result, hex = TRUE, which = "max")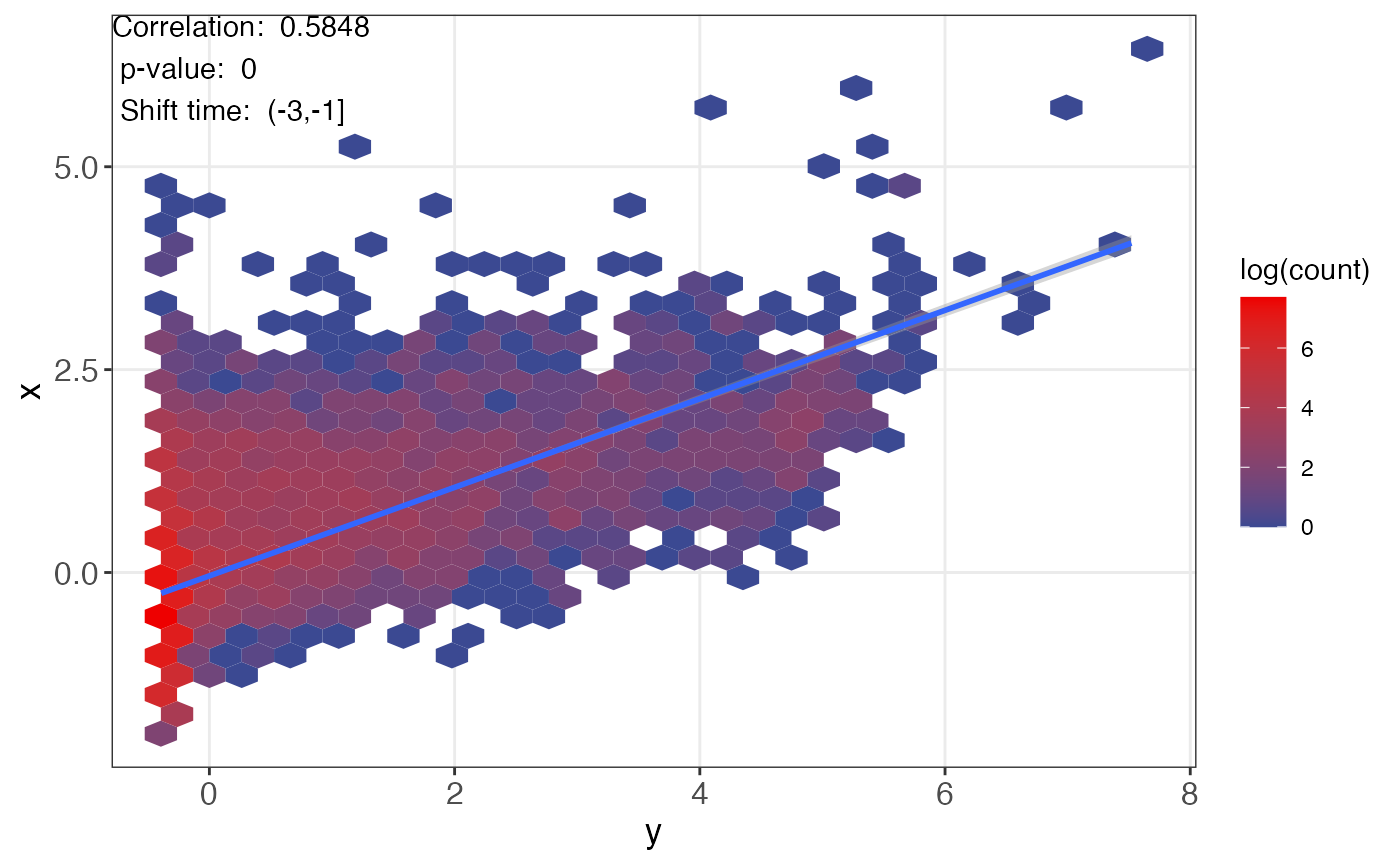
lagged_alignment_plot(object = result, which = "global", x_limit = c(1,50000))