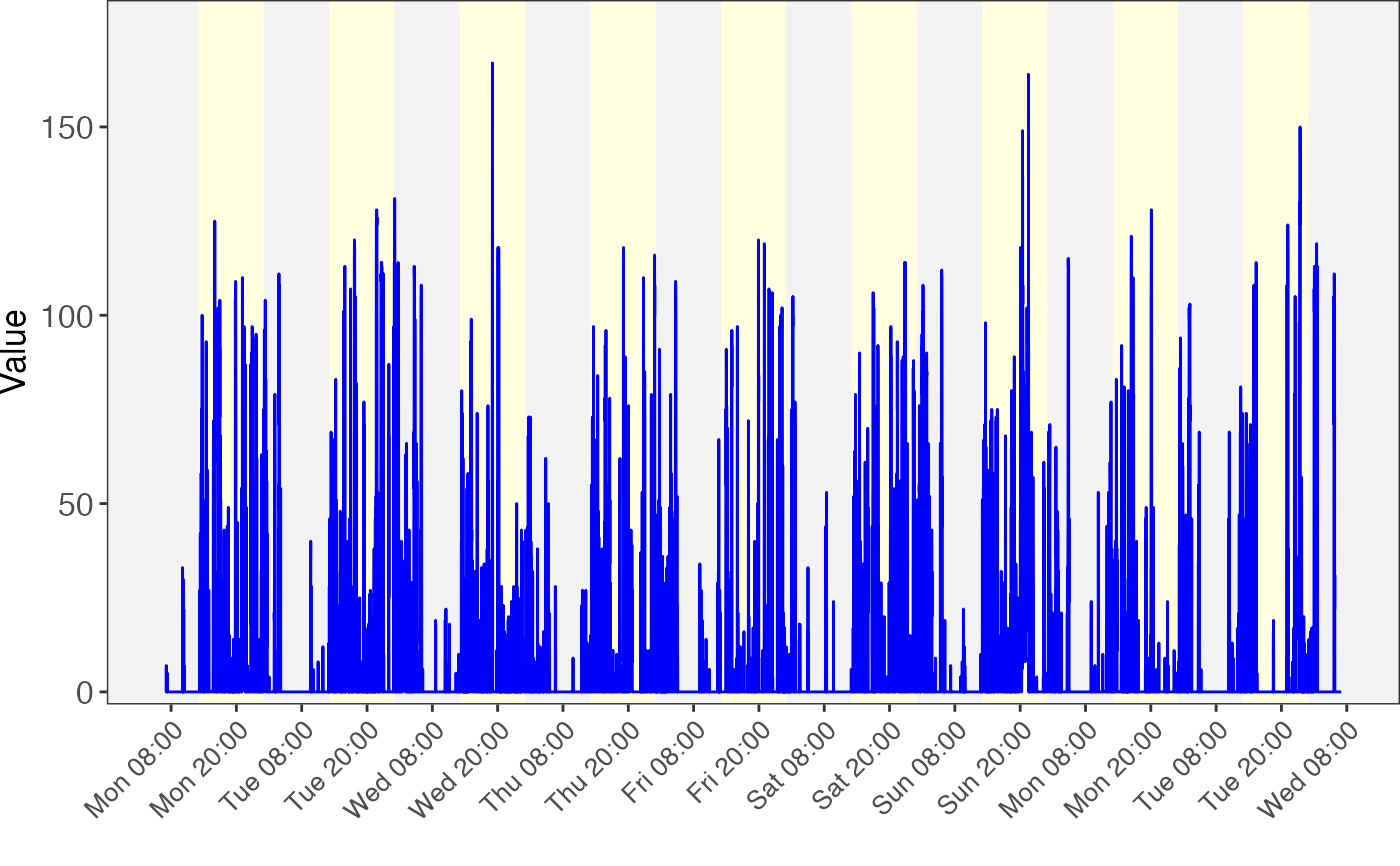
time_plot
time_plot.Rdtime_plot
time_plot(
  x,
  time,
  color = "blue",
  y_axis_name = "Value",
  sun_rise_time = "6:00:00",
  sun_set_time = "18:00:00",
  time_gap = 12,
  add_point = FALSE,
  facet = FALSE
)
Arguments
- x
x
- time
time
- color
color
- y_axis_name
y_axis_name
- sun_rise_time
should be 24 hour format, default "6:00:00"
- sun_set_time
should be 24 hour format, default "18:00:00"
- time_gap
time_gap
- add_point
add_point
- facet
facet or not.
Value
A ggplot2 object.
Examples
data("step_data", package = "laggedcor")

x = step_data$step
time = step_data$time

time_plot(x, time)